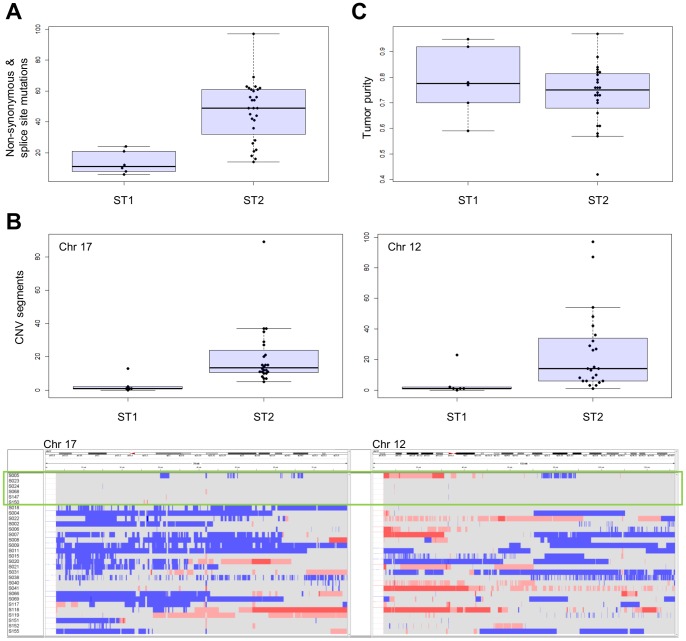
Figure 3. Analysis of genomic alterations in ST1 and ST2.
(A) Comparison of the number of somatic nonsynonymous and splice site mutations. (B) Comparison of the number of CNV segments (upper panel) and CNV profiles (bottom panel) on chromosomes 17 and 12 between ST1 and ST2. Copy number alterations are as follows: CN = 0, dark blue; CN = 1, light blue; CN = 3, pink; and CN ≧4, red). ST1 is enclosed by the green rectangle. (C) Tumor purities of ST1 and ST2.

