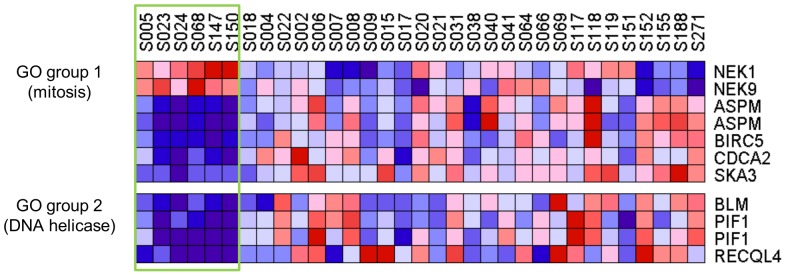
Figure 5. Gene ontology analysis of differentially expressed genes.

Heat-map view of gene ontology (GO) groups. Two GO groups (mitosis and DNA helicase) with significant gene enrichment are indicated as GO groups 1 and 2, respectively. ST1 is enclosed by the green rectangle.
