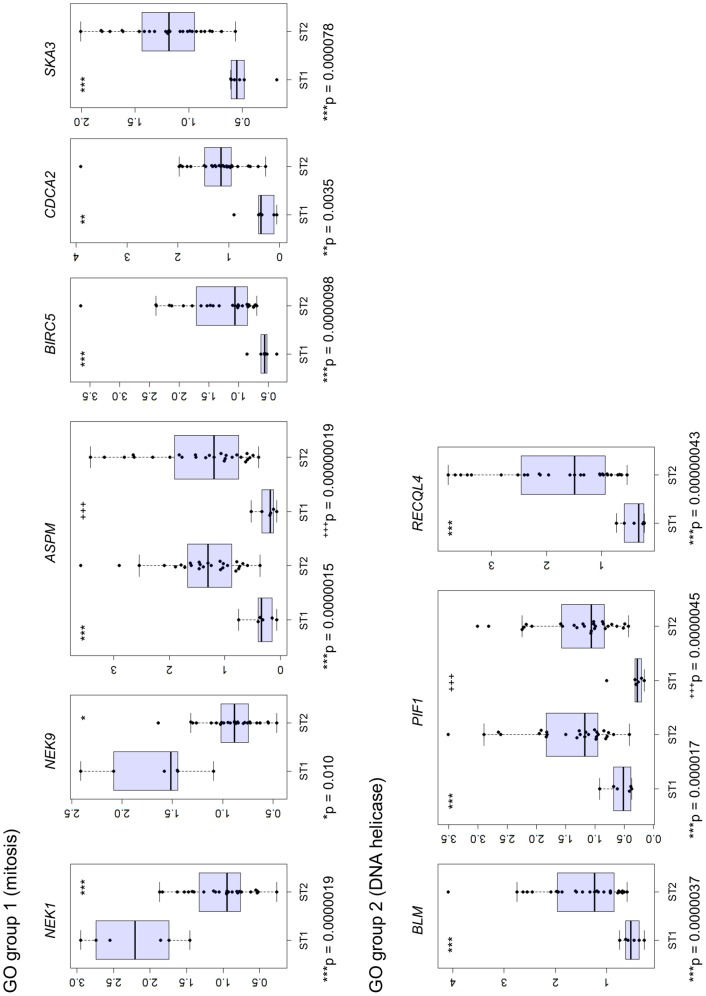
Figure 6. Analysis of the expression of mitotic and DNA helicase genes.
Bee swarm and box plots display the gene expression pattern of ST1 and ST2 patients. Y axis indicates normalized gene expression signals processed by GeneSpring. Asterisks (*) or plus signs (+) indicate t-test p values as follows: *p<0.05, **p<0.01, and *** (+++)p<0.001.

