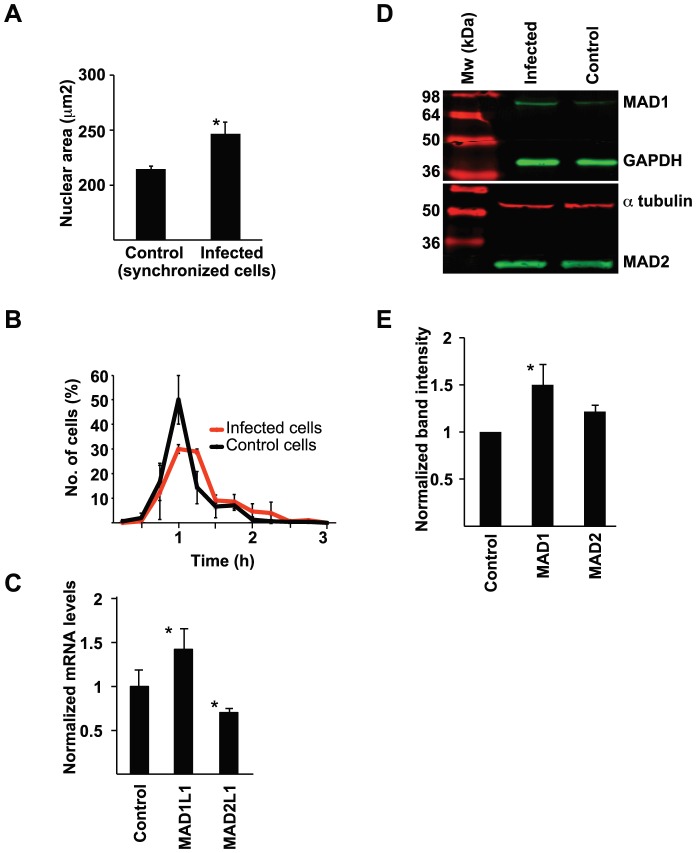
Figure 5. Gonococcal infection causes durations of mitosis, nuclear swelling, and targets regulatory mitotic genes and proteins.
A. VK2/E6E7 cells were synchronized and bacteria were allowed to adhere and invade cells for 24 h. Cells were then fixed and stained with DAPI. The nuclear area of 300 infected and 300 uninfected cells were measured. Data were analyzed using a paired 2-tailed Student's t-test. The average nuclear areas observed in 3 independent experiments are shown (*p<0.05). Error bars represent S.E.M. B. Cells were infected with N. gonorrhoeae and observed for 24 h by live-cell microscopy. DIC images were captured every 15 min at randomly selected positions, and times spent transitioning from prophase to cytokinesis were measured for 150 mitotic cells. The graph shows mean ± standard deviation values for the time required for progression from prophase to cytokinesis, measured in 3 independent experiments. C. VK2/E6E7 cells were infected with N. gonorrhoeae for 24 h. RNA from control cells and infected cells was isolated and qPCR was performed. Average mRNA levels of MAD1L1 and MAD2L1 from 3 independent experiments are shown (*p<0.05). Error bars represent S.E.M. Values were normalized against TUBA1A expression and analyzed using a paired 2-tailed Student's t-test. D. Protein expression in infected cells and control cells was analyzed in western blots using antibodies against of MAD1 and MAD2. GAPDH or α-tubulin was used as loading controls. E. Western blot band intensities were quantified and analyzed with a paired 2-tailed Student's t-test, using GAPDH or α-tubulin expression as controls. Mean expression levels of each protein observed in 3 independent western blots are shown (*p<0.05). Error bars represent S.E.M.

