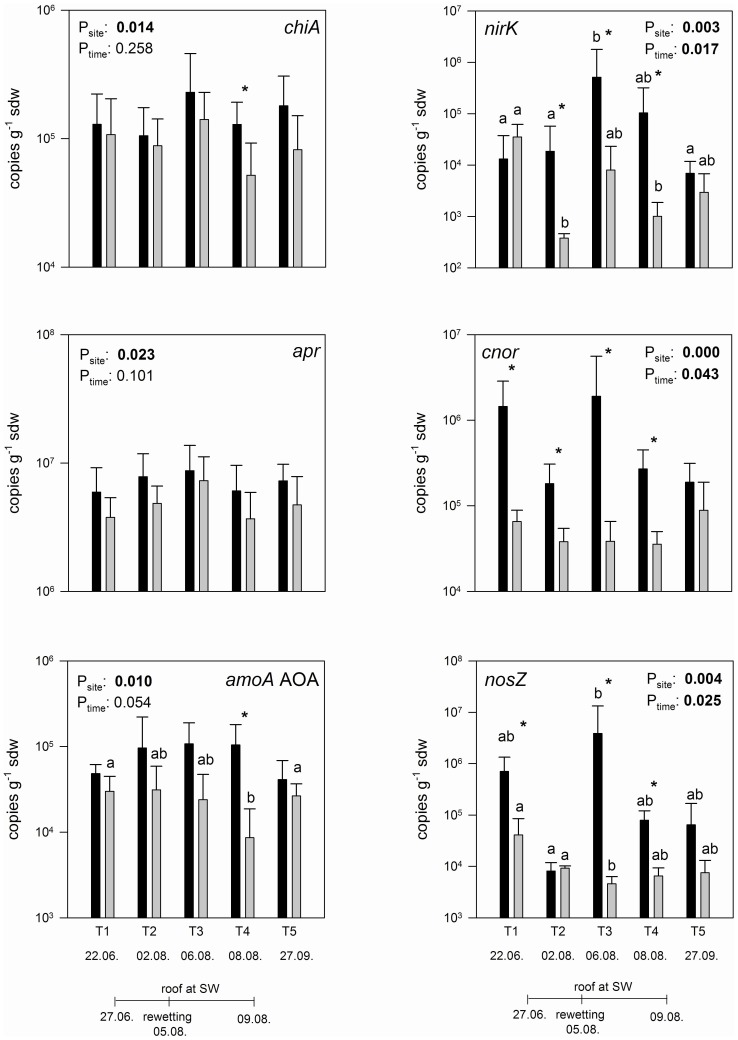
Figure 1. Transcript abundance of functional genes involved in the nitrogen cycle (chiA, apr, amoA AOA, nirK, cnor and nosZ) are shown for NW (black bar) and SW (grey bar) in June (T1), after 39 days drought in August (T2), 24 and 72 hours after rewetting in August (T3, T4) and in September (T5) (n = 8, error bars represent standard deviation of the mean).
Asterisks indicate significant differences between NW and SW at the respective sampling times (Student's T test), whereas lower case letters indicate differences among the sampling period for the respective site (multivariate ANOVA). Significant differences between the factors site and sampling time calculated by multivariate ANOVA are indicated by P values <0.05 (bold letters).

