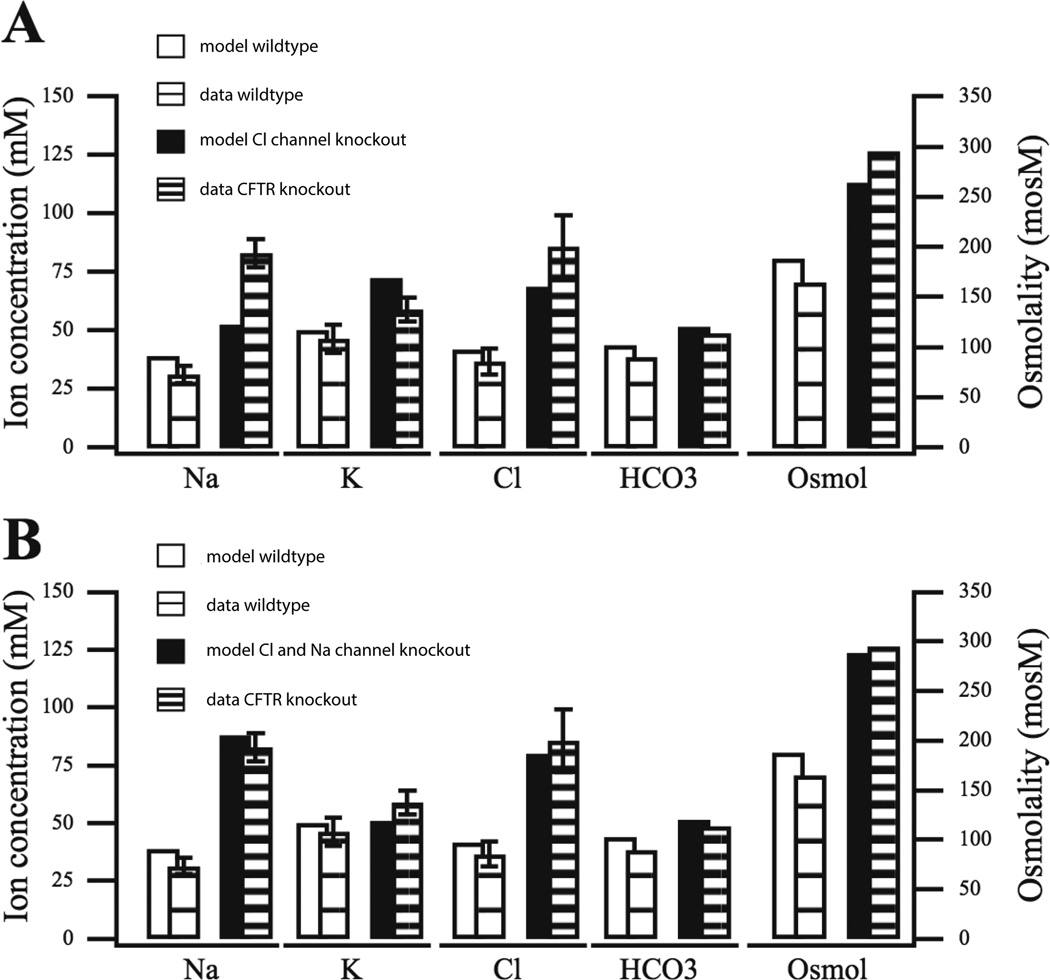
Figure 12.
Model variations against data from the wild-type and CFTR knockout mouse secondary saliva [24]. The CFTR knockout mouse model has the CFTR channel deleted. A: CFTR channel conductance is reduced (to 0.15 of base value). Notice how the model [Na+] for the deletion is unable to capture behavior as measured in the CFTR knockout mouse. B: in addition to the CFTR channel reduction performed in A, the ENaC channel conductance is also reduced (to 0.4 of base value), in which case the model is able to reproduce the observed rise in [Na+].

