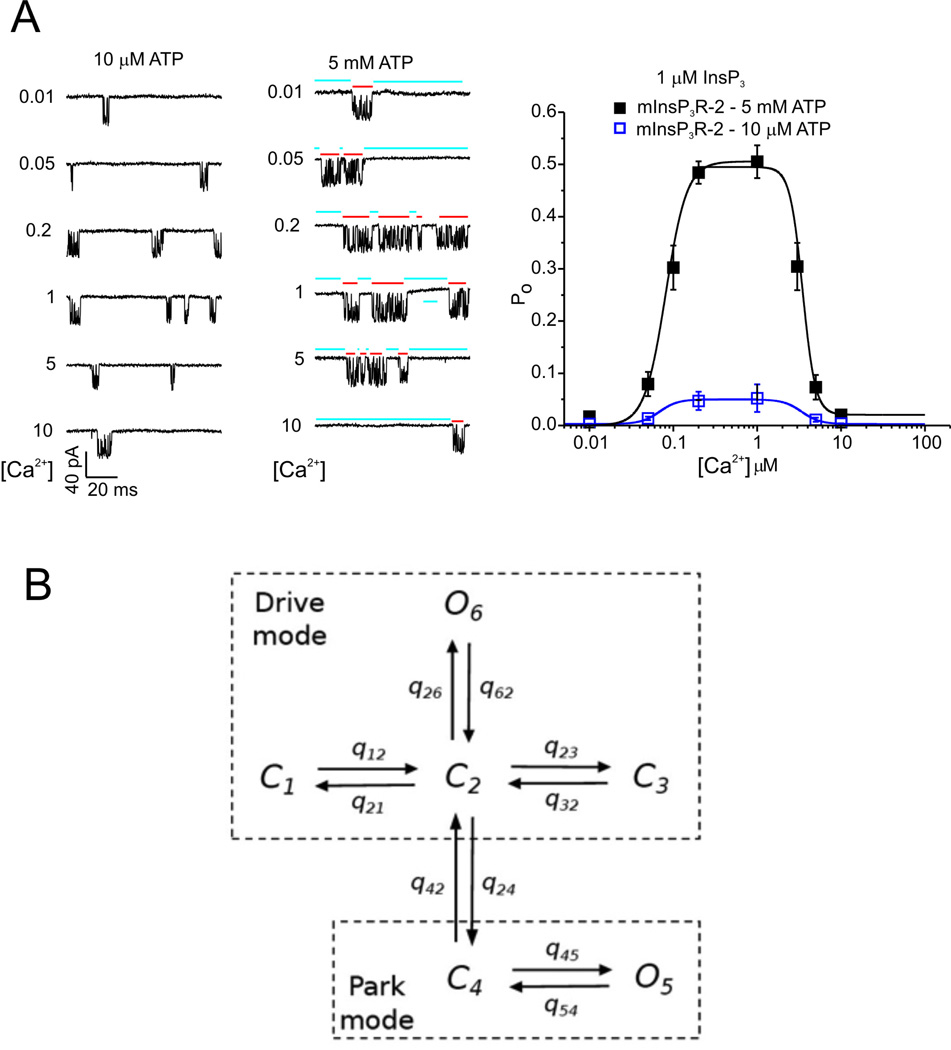
Figure 8.
A: activity from single type-2 IPR recorded from the isolated nuclear envelope, showing modulation by Ca2+ and ATP at submaximal IP3. Two modes of channel activity are evident; a long-lived Park mode that is mostly closed (blue bars), and a bursting mode refered to as Drive mode (red bars). The panel on the right shows the steady-state open probability as a function oc Ca2+ concentration, at a single fixed IP3 concentration and two different ATP concentrations. B: schematic diagram of the IPR model [34]. C and O denote, respectively, closed and open states. The only transitions that are dependent on [Ca2+] and [IP3] are q42 and q24, the transitions between the Park and Drive modes.

