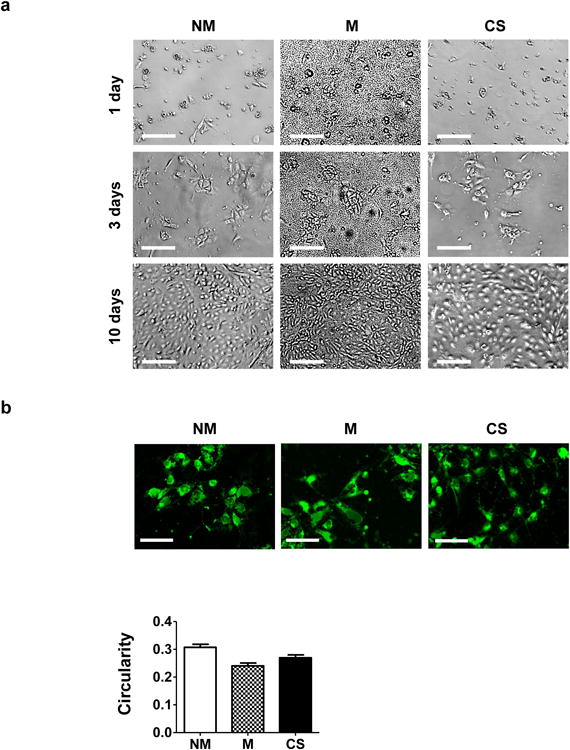
Figure 2. Attachment and proliferation of hiPSCs on different matrices.

(a) Bright field images for hiPSCs after 1, 3, and 10 days of culture on non-mineralized (NM) and mineralized (M) hydrogels and gelatin-coated coverslips (CS). Scale bar: 200 μm. (b) Images of hiPSCs labeled using CellTracker after 3 days of culture on non-mineralized and mineralized hydrogels and coverslips. Scale bar: 100 μm. The bar graph shows the quantitative representation of the circularity; the circularity indices were determined from the stained images. Data are shown as mean ± standard errors (n=30).
