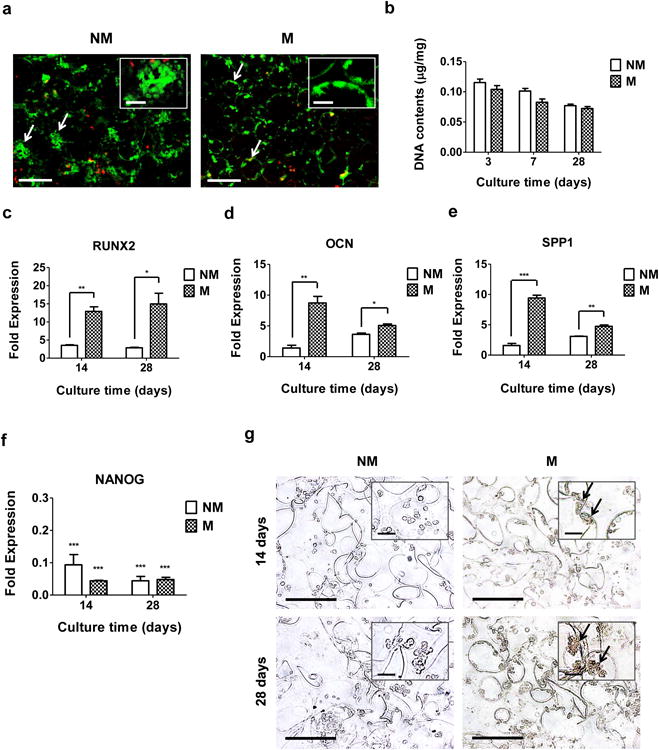
Figure 4. Osteogenic differentiation of hiPSCs on CaP-rich mineralized macroporous hydrogels in 3-D culture.

(a) Live-dead staining of hiPSC-laden non-mineralized (NM) and mineralized (M) macroporous hydrogels after 3 days of culture. Arrows and inset indicate aggregated and spread hiPSCs within the non-mineralized and mineralized matrices, respectively. Scale bars represent 200 μm and scale bars in the inset indicate 50 μm. (b) DNA contents of hiPSCs cultured using non-mineralized and mineralized matrices as a function of culture time. Data are presented as DNA contents after normalization to dry weight of matrices. Gene expression of (c) RUNX2, (d) OCN, (e) SPP1, and (f) NANOG of hiPSCs on non-mineralized and mineralized matrices as a function of culture time. Data are presented as fold expression of target genes after normalization to undifferentiated, pluripotent hiPSCs. (g) Immunohistochemical staining for OCN of hiPSCs on non-mineralized and mineralized matrices as a function of culture time. Scale bars represent 100 μm. Inset shows high magnification images. Arrows indicate positive stains. Scale bars in the inset represent 20 μm. Data are displayed as mean ± standard errors (n=3). (c-e) Two groups at the same time point were compared by two-tailed Student's t-test. (f) All the groups were compared to undifferentiated, pluripotent hiPSCs prior to their culture on all matrices by two-way ANOVA with Bonferroni post-hoc test. Asterisks represent statistical significances according to p-values. (*: p < 0.05; **: p < 0.01; ***: p < 0.001).
