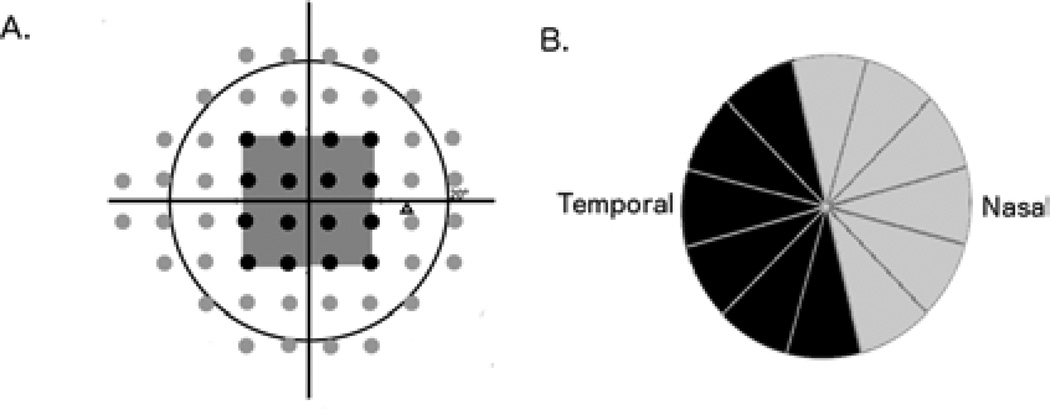
Figure 1.
Illustration of the 24-2 visual field map for the right eye showing test locations used for retinal ganglion cell estimates for total (black and grey points) and macular (16 black points corresponding to the central 10 degrees) estimates (A). Illustration of the 6 clock hours of the optical coherence tomography circumpapillary retinal nerve fiber layer thickness scan used for the structural component of the macular retinal ganglion cell number estimate (the black sectors in the figure) (B).

