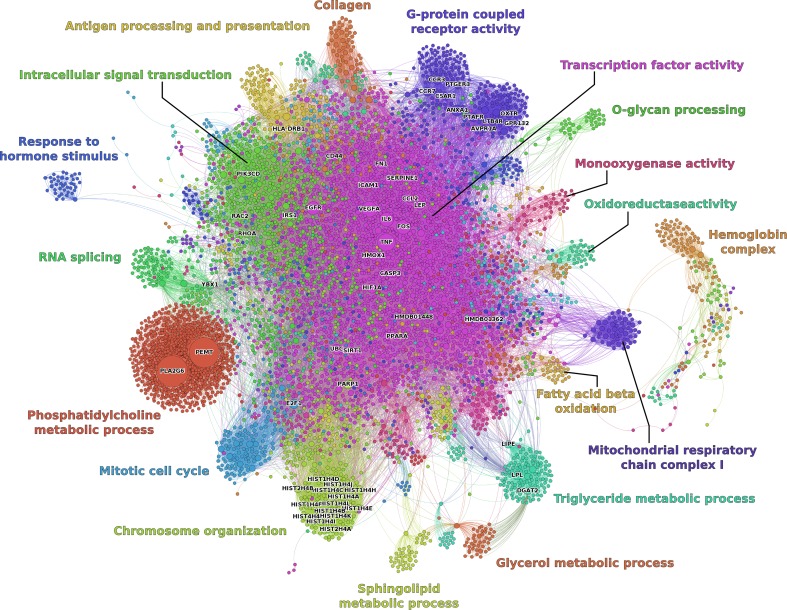
Fig. 1.
Visualization of the white adipose tissue health reference network. Nodes are colored by clustering based on network topology. Clusters are annotated with biological function based on GO overrepresentation analysis (“Methods”). Node size is scaled according to degree (number of interactions)

