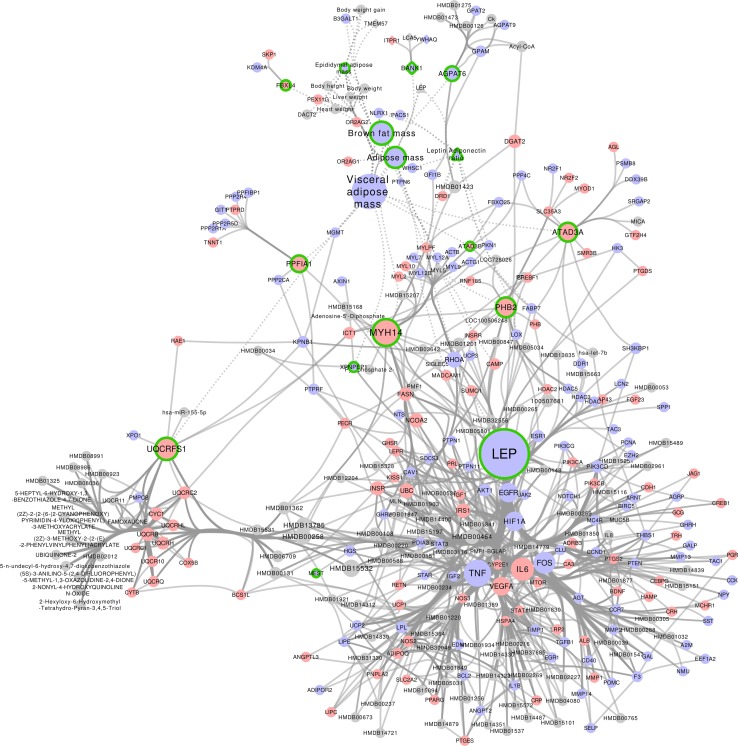
Fig. 2.
The network signature for process Adipose expandability. Nodes are colored according to the sign of the average fold-change across different studies (blue negative and red positive). Nodes with a green border are seed nodes (i.e., significant aggregated p-value and consistent fold-change across studies), and other nodes are neighbors of these seed nodes and included in the network to add biological context. Solid edges indicate knowledge-based molecular interactions; dotted lines indicate interactions based on correlations in the reference datasets

