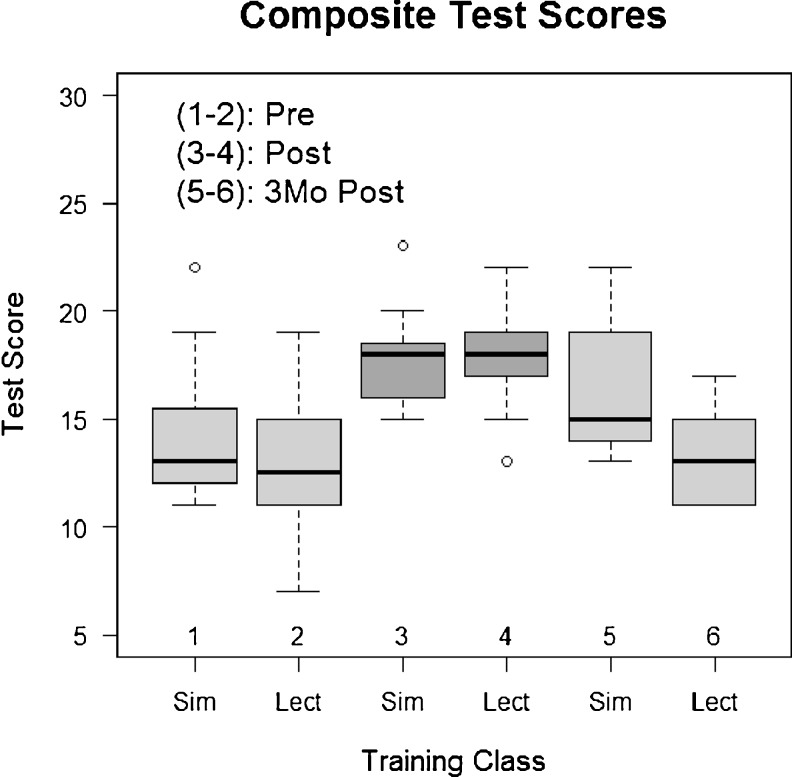
Fig. 1.
Composite test scores The test scores for each training class (Sim vs Lect) at each testing period (Pre, Post, 3Mo Post) are represented by box-and-whisker plots. For each box-and-whisker plot, the solid dark line represents the median Test score. The bottom and top of the box represent the inter-quartile range (1st and 3rd quartiles). The whiskers represent the minimum and maximum scores excluding outliers. The circles represent outlier values

