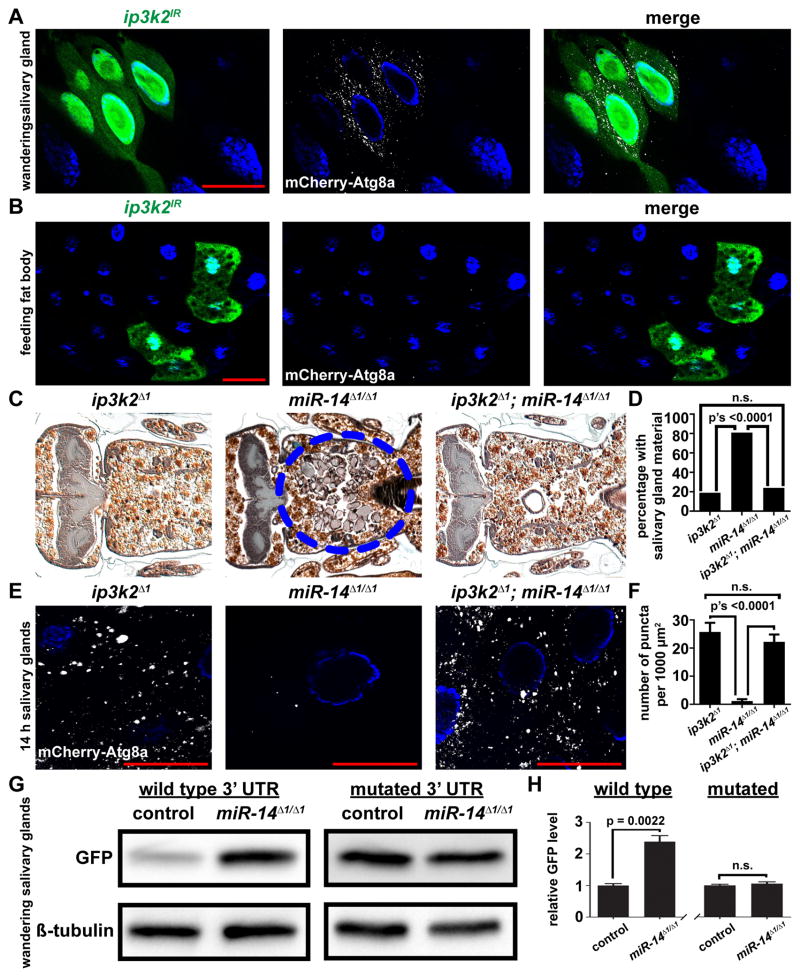
Figure 4. miR-14 targets inositol 1,4,5-trisphosphate kinase 2 to regulate autophagy during salivary gland death.
(A and B) Salivary glands dissected from wandering larvae (A) and fat bodies dissected from feeding larvae (B) expressing mCherry-Atg8a in all cells, and ip3k2 knockdown specifically in GFP-marked clone cells (hsflp/w; pmCherry-Atg8a/UAS-ip3k2IR; act<FRT, cd2, FRT>Gal4, UAS-GFP/+) analyzed for mCherry-Atg8a puncta.
(C) Samples from ip3k2 mutant animals (ip3k2 Δ1/Y; +/miR-14Δ1), n = 21 (left), miR-14 null mutant animals (ip3k2 Δ1/w; miR-14Δ1/miR-14Δ1), n = 26 (middle), and ip3k2, miR-14 double mutant animals (ip3k2 Δ1/Y; miR-14Δ1/miR-14Δ1), n = 50 (right), analyzed by histology for the presence of salivary gland material (blue dotted circle) 24 h after puparium formation.
(D) Quantification of data from (C). Data are represented as mean. Statistical significance was determined using a Chi-squared test.
(E) mCherry-Atg8a was expressed in ip3k2 mutant animals (ip3k2 Δ1/Y; miR-14Δ1/pmCherry-Atg8a), miR-14 null mutant animals (ip3k2 Δ1/w; miR-14Δ1/miR-14Δ1, pmCherry-Atg8a), and ip3k2, miR-14 null double mutant animals (ip3k2 Δ1/Y; miR-14Δ1/miR-14Δ1, pmCherry-Atg8a). Salivary glands were dissected 14 h after puparium formation for analyses of mCherry-Atg8a puncta.
(F) Quantification of data from (E). Data are represented as mean +/− SEM; n ≥ 16. Statistical significance was determined using a Student’s t-test. Salivary glands and fat bodies were all stained with Hoechst (blue). Scale bars represent 50 μm.
(G) Protein extracts from salivary glands dissected from wandering larvae of control (w; miR-14Δ1/+; tub-GFP-ip3k2 3′UTR/+) and miR-14 null mutant (w; miR-14Δ1/miR-14Δ1; tub-GFP-ip3k2 3′UTR/+) animals expressing a GFP sensor containing either the wild type ip3k2 3′UTR or a mutated miR-14 binding site in the 3′UTR, and analyzed by immuno-blot with anti-GFP antibody.
(H) Quantification of data from (G). Wild type and mutated sensors are normalized to Beta-tubulin and plotted relative to their respective controls +/− SEM; n’s = 3. Statistical significance was determined using a Student’s t-test.

