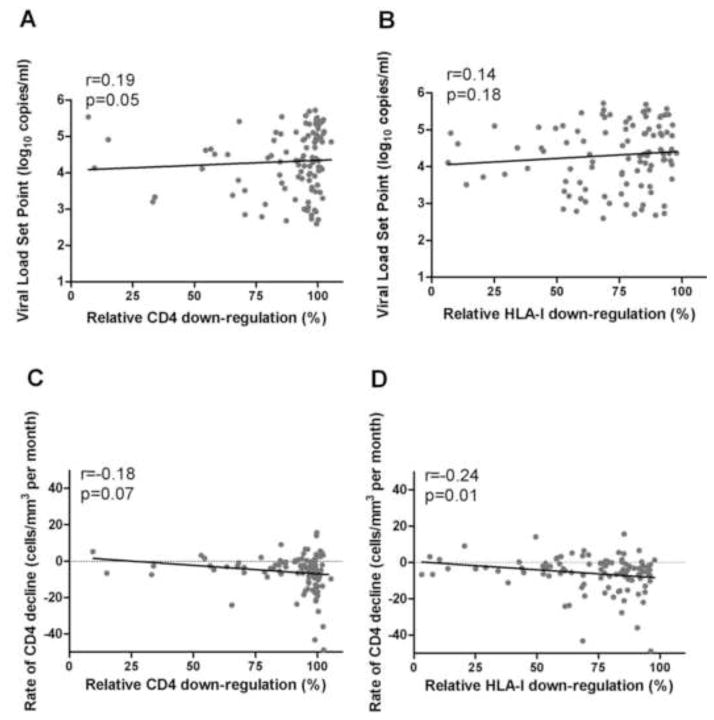
Figure 3. Relationship between Nef functions in acute/early infection and markers of disease progression.
Panel A and B: A trend for a positive correlation between higher CD4 down-regulation in acute/early infection and subsequently higher viral load set point is shown (A), while no significant relationship was observed between HLA-I down-regulation and viral load set point (B) (n=102). Panel C and D: Associations between faster rate of CD4 decline and higher Nef-mediated CD4 (C) or HLA-I (D) down-regulation in acute/early infection are shown, but this was statistically significant for HLA-I down-regulation only (n=107). Data in graphs C and D are restricted to −50 to +50 cells/mm3 per month, and thus do not include 5 outlier data points. Spearman’s correlation was used to assess significance of relationships.

