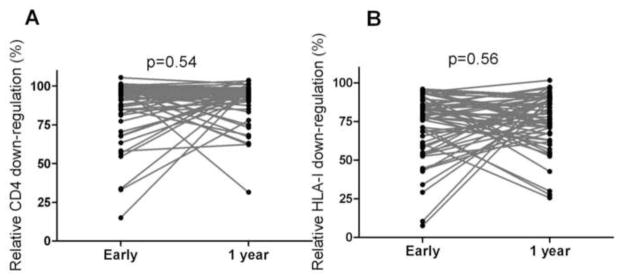
Figure 6. Nef functions over the first year of infection.

Panel A and B: Graphs show no consistent increase or decrease in Nef-mediated CD4 (A) and HLA-I (B) down-regulation over the first year of infection. Functions of 56 pairs of matched Nef clones derived from acute/early infection and 1 year post-infection from the same individuals are shown. P values from the Wilcoxon matched-pairs test are shown.
