
Fig. 2.
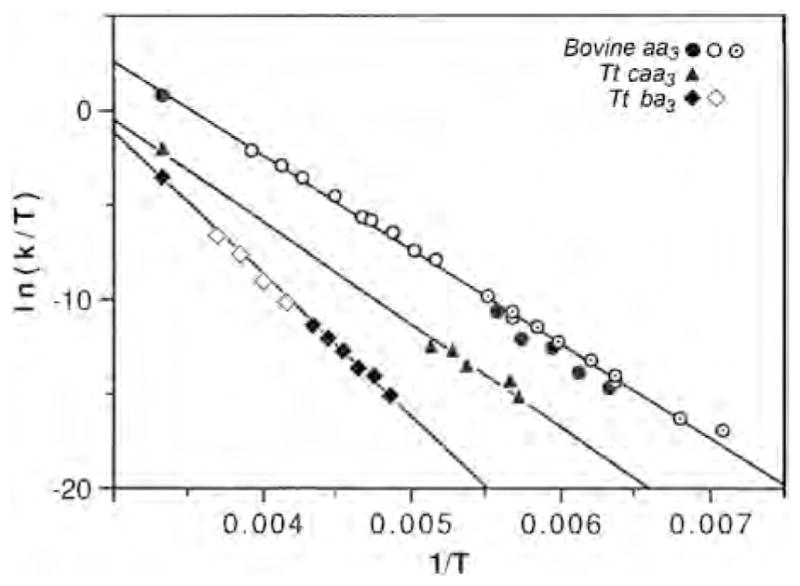
The Eyring plot for T. thermophilus cytochrome ba3–CO, T. thermophilus caa3–CO and bovine aa3–CO recombination, measured from the Fe–CO infrared peaks (low temperature) and by kinetic UV–vis spectrophotometry at room temperature. Data are from current work and [32,33]. For the bovine enzyme, open circles are from Sharrock and Yonetani [77] and the circles with concentric dots are from Fiamingo et al. [42].