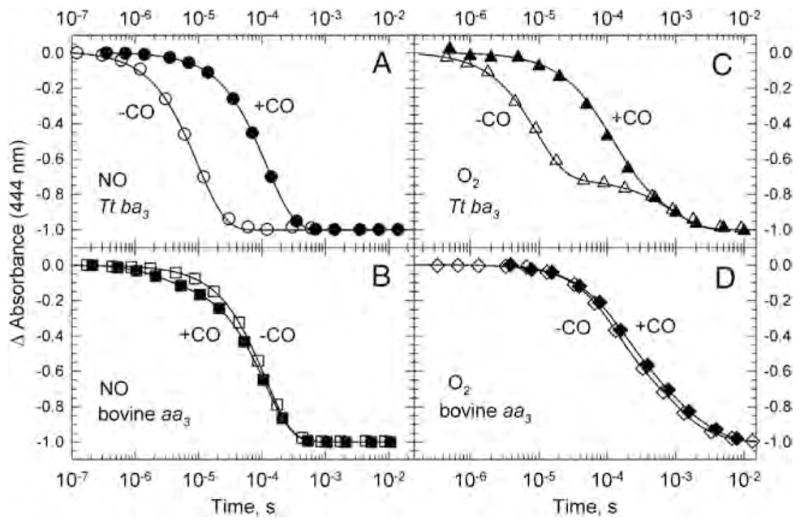
Fig. 9.

Comparison of the transient absorbance changes at 444 nm during the reaction of the fully reduced ba3 (panels A and C) and bovine aa3 (panels B and D) with photoproduced NO (A and B) and photoproduced O2 (C and D) in the presence of CO (filled symbols) and absence of CO (open symbols). The kinetics traces are from time-resolved optical absorption data recorded at multiple wavelengths and are normalized to the total absorbance change. The solid lines represent the absorbance traces at 444 nm calculated on the basis of a single exponential fit. The conditions are those reported in [40,60].
