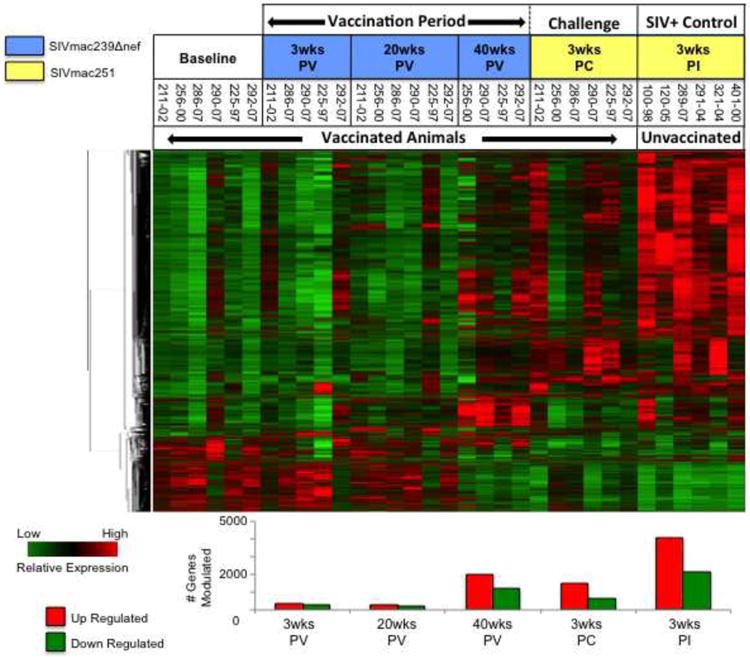
Figure 1. Hierarchical clustering of genes regulated in CD8+ T cells during the vaccination period and challenge.

Genes up or down modulated by at least 1.5-fold (p value ≤ 0.05) in vaccinated animals and unvaccinated controls were clustered hierarchically to identify common patterns of regulation following vaccination with SIVΔnef and infection of vaccinated animals and unvaccinated controls with SIVmac251. The number of genes up (red bars) and down (green bars) regulated at each time point is depicted graphically below the heat map.
