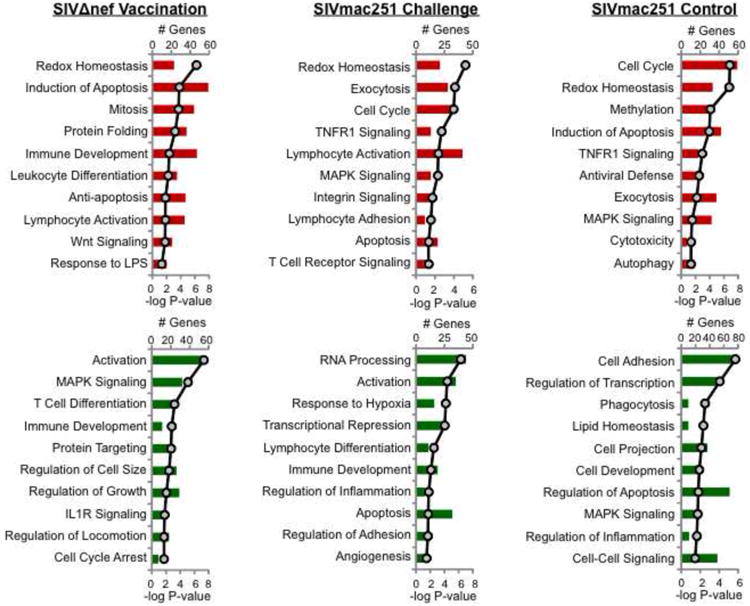
Figure 2. Pathway analysis of genes regulated in circulating CD8+ T cells.

The top 10 pathways and processes statistically enriched in the lists of up and down regulated genes generated through hierarchical clustering were identified (A) during the vaccination period, (B) 3 weeks following SIVmac251 challenge of vaccinated animals, and (C) 3 weeks following SIVmac251 infection of unvaccinated controls. The number of genes modulated is depicted in bar graphs (red=up regulated genes; green=down regulated genes) on the primary x-axis, and statistical confidence (P-value) is depicted linearly on the secondary x-axis.
