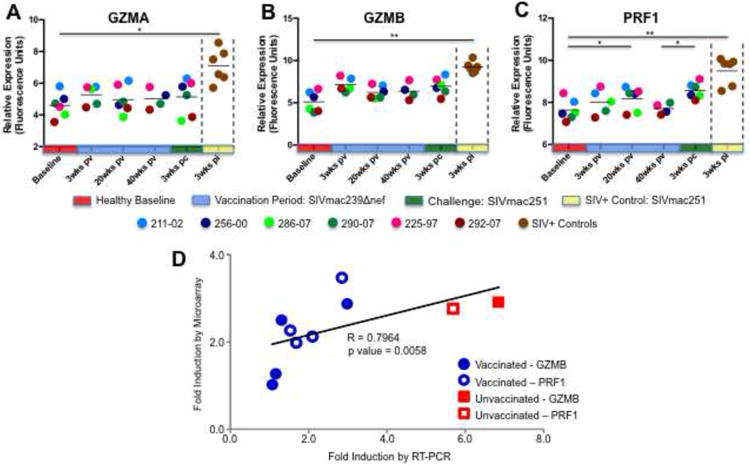
Figure 4. Systemic expression of cytolytic enzymes in response to SIVΔnef and SIVmac251.

The transcriptional profiles of granzymes A (A) and B (B) and perforin (C) in peripheral CD8+ T cells of SIVΔnef vaccinated animals and unvaccinated controls as determined by microarray are shown (* denotes p-value ≤ 0.05; ** denotes p-value ≤ 0.01). (D) The magnitude of increase (fold-induction, in comparison to unvaccinated uninfected animals) in perforin and granzyme A expression was compared in vaccinated animals and unvaccinated controls by quantitative real-time PCR (qRT-PCR) and compared to induction levels generated by microarray analysis. The strength and statistical significance of the relationship was determined through Spearman's rank correlation coefficient analysis.
