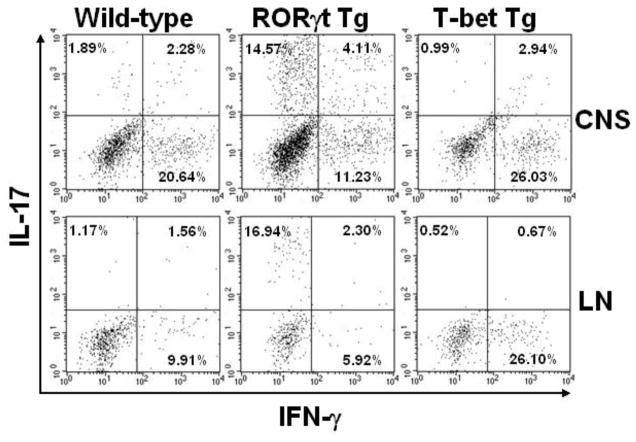
Figure 6.
Flow cytometric analysis of MNCs from mice 19 days after MOG sensitization. Both wild-type and RORγt Tg mice were at the peak of EAE, while T-bet Tg mice were asymptomatic. RORγt Tg mice and T-bet Tg mice had higher percentages of IL-17+ and IFN-γ+ CD4+ cells, compared with wild-type mice, respectively. MNCs from the CNS or inguinal lymph nodes were stimulated with MOG35-55, PMA, ionomycin and brefeldin A and stained for the cell surface marker CD4 and intracellular cytokines IL-17 and IFN-γ. Representative dot plots after gating on CD4+ cells (four mice/group). CNS: central nervous system; LN: lymph node.

