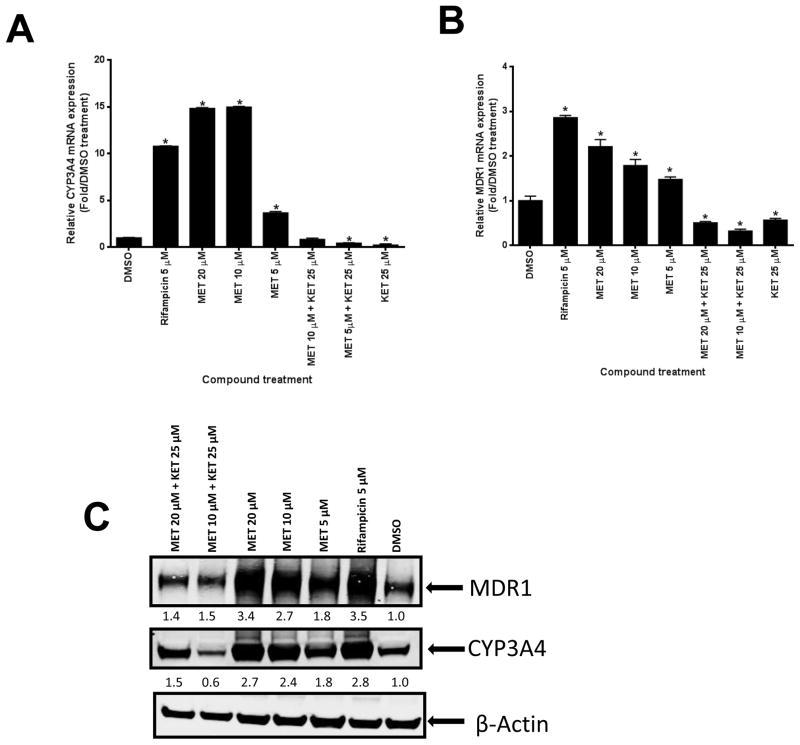
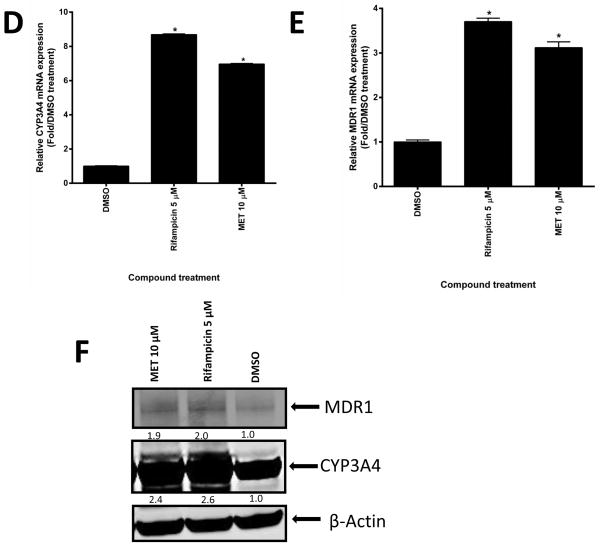
Fig. 6. MET induced mRNA and protein expression of CYP3A4 and MDR1 in human hepatocytes.
(A–C: donor 1) (A) Human CYP3A4 and (B) MDR1 mRNA expression were analyzed by real-time PCR assays of human hepatocytes after 48-h treatment with different compounds as indicated (*p < 0.05; in the t-test, comparisons were made between compound-treated and DMSO-treated samples). (C) CYP3A4 and MDR1 protein levels in human hepatocytes were determined by Western blotting using anti-CYP3A4 and anti-MDR1 sequentially. The numbers below the protein bands indicate the relative intensity of the protein bands, with the DMSO treated sample set as “1”. (D–F: donor 2) (D) Human CYP3A4 and (E) MDR1 mRNA expression were analyzed as described in (A) and (B) (*p < 0.05; in the t-test, comparisons were made between compound-treated and DMSO-treated samples). (F) CYP3A4 and MDR1 were detected using anti-CYP3A4 and anti-MDR1 simultaneously, and quantified as described in (C). Anti-β-actin was finally used to detect β-actin in both (C) and (F).


