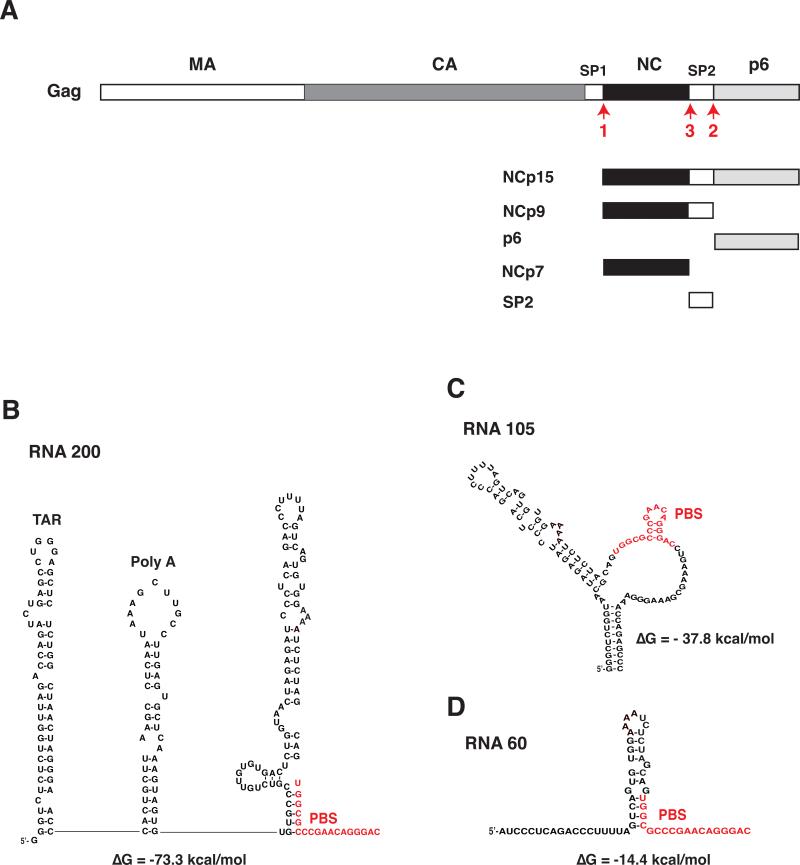
Fig. 1.
Schematic representation of NC proteins and RNA templates used in this study. (A) Proteins produced by C-terminal cleavage of Gag. HIV-1 Gag is shown with each domain indicated by rectangles depicted as follows: MA, open; CA, dark gray; spacer peptide 1 (SP1), open; NCp7, closed; SP2, open; p6, light gray. The proteins derived from the Gag C-terminus, i.e., NCp15, NCp9, p6, NCp7, and SP2, are also shown. The red arrows labeled 1, 2, and 3 refer to the primary, secondary, and tertiary PR cleavages at the C-terminus of Gag (Swanstrom and Wills, 1997). (B), (C), and (D) Sequence of RNA templates and secondary structure, based on mFold analysis (Zuker, 2003): (B), RNA 200; (C), RNA 105; (D), RNA 60. Two major structural elements, i.e., the TAR and Poly A stem-loops, are present only in RNA 200. The other two templates contain varying amounts of sequence upstream of the PBS and in each case, the PBS is largely unpaired. RNA 105 also has unpaired bases downstream of the PBS in addition to a short 10-bp stem formed with bases upstream and downstream of the PBS. The PBS sequence in each template is highlighted in red. The predicted ΔG values are shown beneath the structures. The diagrams are not drawn to scale.

