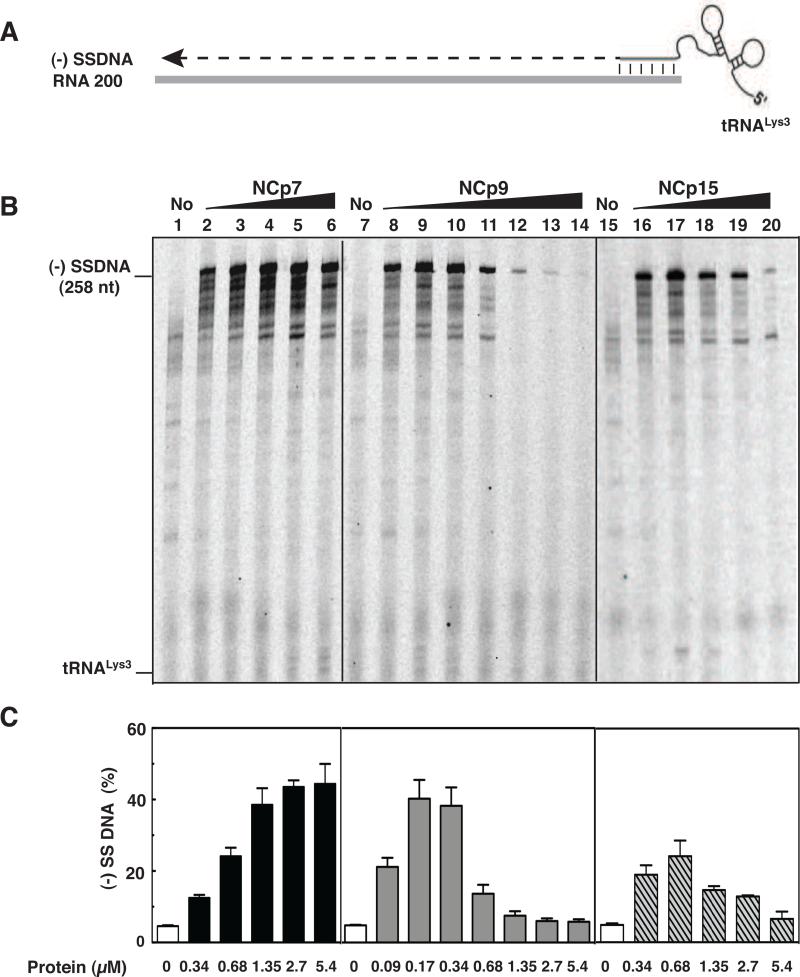
Fig. 2.
Effect of HIV-1 NC proteins on (-) SSDNA synthesis. (A) Reconstituted system used for assay of (-) SSDNA synthesis. The diagram shows annealing (vertical lines) of the 18 nt at the 3’ end of tRNALys3 to the complementary 18-nt PBS in RNA 200 (gray rectangle), which serves as the template for RT-catalyzed synthesis of (-) SSDNA (dashed line). The diagram is not drawn to scale. (B) Gel analysis. Unlabeled tRNALys3 was annealed to RNA 200 in the absence (lanes 1, 7, and 15) or presence of increasing concentrations of NCp7 (lanes 2 to 6), NCp9 (lanes 8 to 14), and NCp15 (lanes 16 to 20) and was extended by HIV-1 RT. The DNA products were separated by PAGE in a 6% denaturing gel. The position of marker tRNALys3 is shown on the left. (C) Bar graphs showing the percentage (%) of (-) SSDNA product synthesized as a function of NC protein concentration. Symbols: no protein, open bars; NCp7, closed bars; NCp9, gray bars; NCp15, hatched bars.

