Fig. 5.
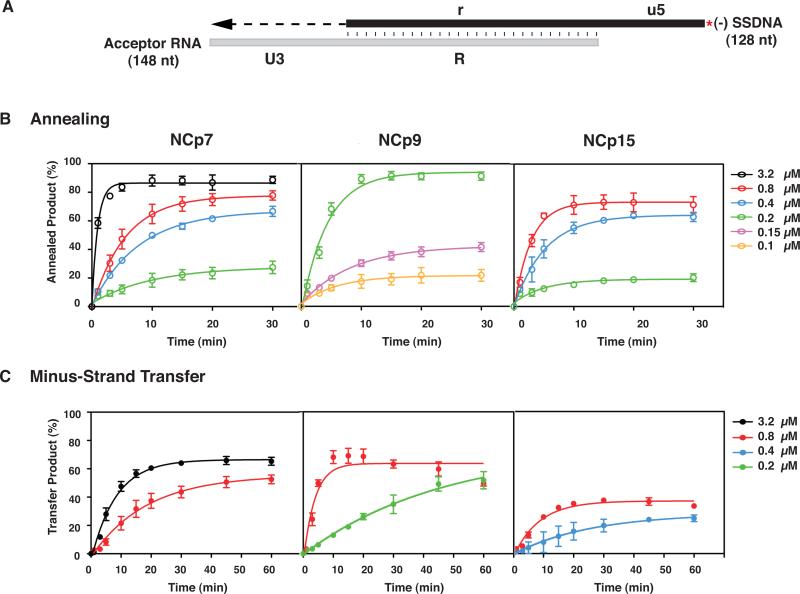
Kinetics of minus-strand annealing and transfer in the presence of NCp7, NCp9, and NCp15. (A) Reconstituted system used for the minus-strand transfer assay. The diagram shows the acceptor RNA with a portion of U3 (54 nt) and the R sequence from the 3’ end of the HIV-1 genome and (-) SSDNA with a portion of u5 and the r sequence, complementary to the sequence at the 5’ end of the viral genome (Guo et al., 1997; Heilman-Miller et al., 2004). Annealing of the R regions in RNA 148 and 33P-labeled DNA 128 is depicted by vertical lines. The red asterisk indicates that the (-) SSDNA is labeled at its 5’ end with 33P. The U3 sequence serves as the template for RT-catalyzed extension of annealed (-) SSDNA. The final DNA transfer product is 182 nt. The diagram is not drawn to scale. (B) Annealing and (C) Minus-Strand Transfer. Reactions were incubated at 37 °C with different concentrations of NCp7, NCp9, or NCp15 for up to 30 (B) or 60 (C) min and analyzed as described in Materials and Methods. The % annealed product (B) and % minus-strand transfer product (C) were plotted against time of incubation. The data were fit to a single exponential equation. Symbols: Annealing, open; Minus-Strand Transfer, closed. Protein concentrations are indicated by the following colors: 0.1 μM, yellow, 0.15 μM, lavender; 0.2 μM, green, 0.4 μM, blue; 0.8 μM, red and 3.2 μM, black. Note that in this series of experiments, the maximum values for the minus NC controls were less than 7% (annealing) and 3% (minus-strand transfer).

