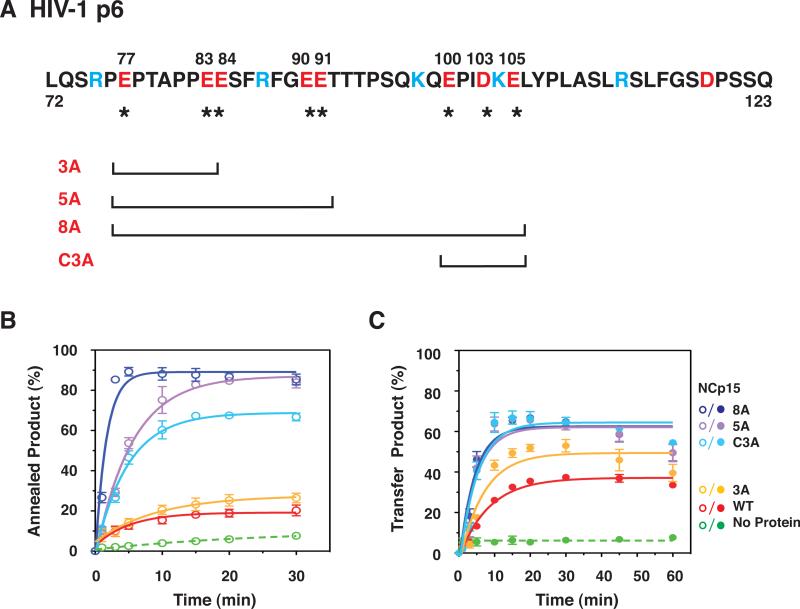
Fig. 8.
Effect of WT NCp15 and mutants with changes in the C-terminal p6 domain on the kinetics of minus-strand annealing and strand transfer. (A) Primary sequence of HIV-1 p6 and schematic representation of C-terminal NCp15 mutants. The acidic and basic residues are highlighted in red and blue, respectively. Acidic residues (E or D) that were changed to A are identified by their position number in the NCp15 sequence (above) and with an asterisk (underneath). The mutants are designated by the number of Ala substitutions. C3A refers to mutation of C-terminal residues 100, 103, and 105. The square brackets, one at each end, show the region that has the Ala substitutions for each mutant. (B) and (C) Kinetics of minus-strand annealing (B) and strand transfer (C) in reactions with WT NCp15 and mutants. In (B), the NC concentrations were all 0.2 μM; in (C), the concentrations were all 0.8 μM, with the exception of 8A, which was 0.4 μM. The data for all of the NC-containing reactions (solid lines) were fit to a single exponential equation. The curves are highlighted in color as follows: WT, red; 3A, yellow; C3A, light blue; 5A, lavender; and 8A, dark blue. The no protein controls (dashed lines) are highlighted in green. Symbols: Annealing, open; Minus-Strand Transfer, closed. The % annealed and transfer products were plotted against time of incubation.

