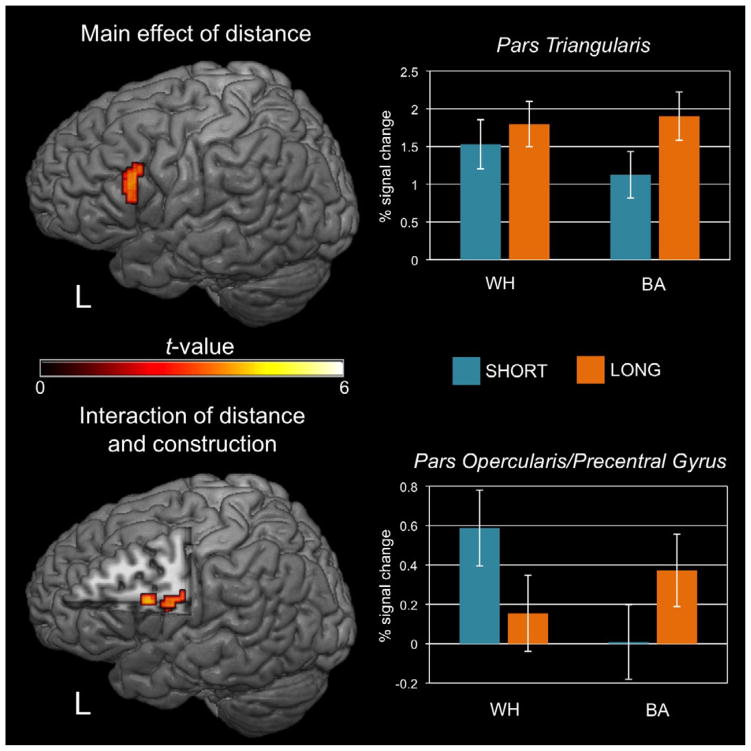
Fig. 1.
Group activation maps (n = 25) displayed in Talairach space on a template brain for the main effect of distance (top) and the interaction of distance and construction (bottom).
Activations for the main effect of distance were corrected for multiple comparisons (FWE) at p < 0.05 using an individual t-threshold of p < 0.001 (one-tailed) and a cluster size threshold of 608 mm3. Activations for the interaction are displayed at a reduced cluster size threshold of 200 mm3. Barplots indicate average percent signal change for each condition within selected clusters of activation (error bars indicate standard error of the mean).

