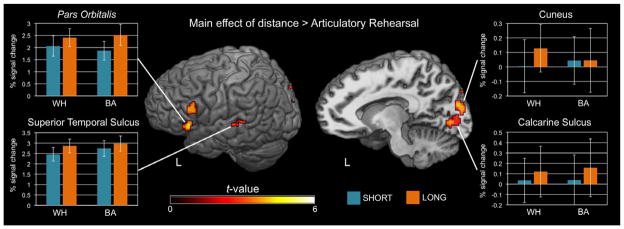
Fig. 4.

Group activation maps (n = 23) displayed in Talairach space on a template brain for the main effect of distance > articulatory rehearsal. Activations are shown using an individual t-threshold of p < 0.001 (one-tailed) and a cluster size threshold of 300 mm3. Barplots indicate average percent signal change for each condition within selected clusters of activation (error bars indicate standard error of the mean).
