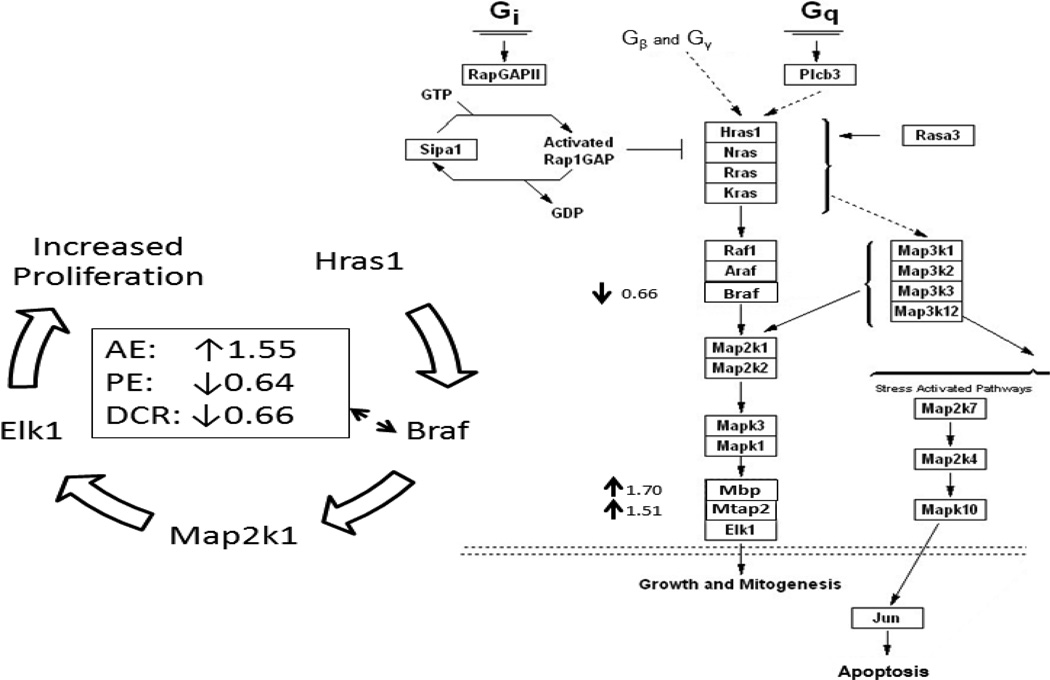
Figure 3.
The Hras-Braf MAP-Kinase pathway visualized using GenMAPP software. Right panel: representative gene expression in Hras-Braf MAP-Kinase pathway for DCR verse the control, indicating 0.66-fold down-expression of Braf but 1.70- and 1.51-fold over-expression of Mbp (myelin basic protein) and Mtab2 (methanol cobalamin methyltransferase 2), respectively. Left panel: summary overview of Braf expression in AE, PE, and DCR verse the control, representing 1.55-fold increase in AE, but 0.64- and 0.66-fold decrease in PE and DCR, respectively.

