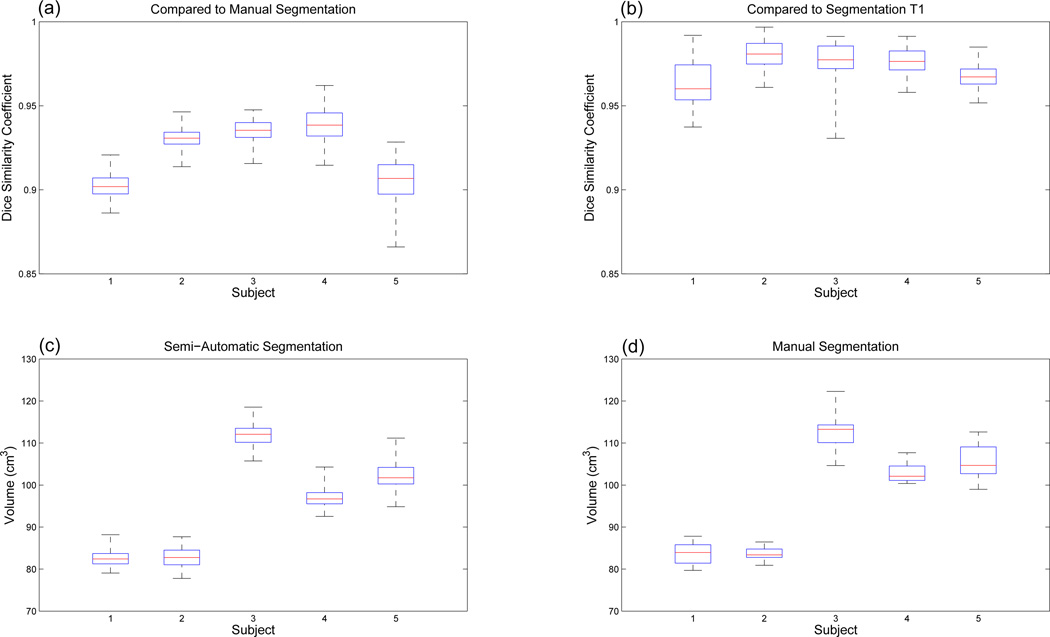
Figure 8.
DSC and volume box plots for the repeated semi-automatic segmentations and the manual segmentations. The red central mark is the median, the edges of the box are the 25th and 75th percentiles, and the whiskers extend to the most extreme data points. (a) DSCs between the repeated semi-automatic segmentations and the manual segmentations. (b) DSCs between the semi-automatic segmentations T1 and the other 7 sets of semi-automatic segmentations (T2-T8). (c) Volumes of the repeated semi-automatic segmentations. (d) Volumes of the manual segmentations.

