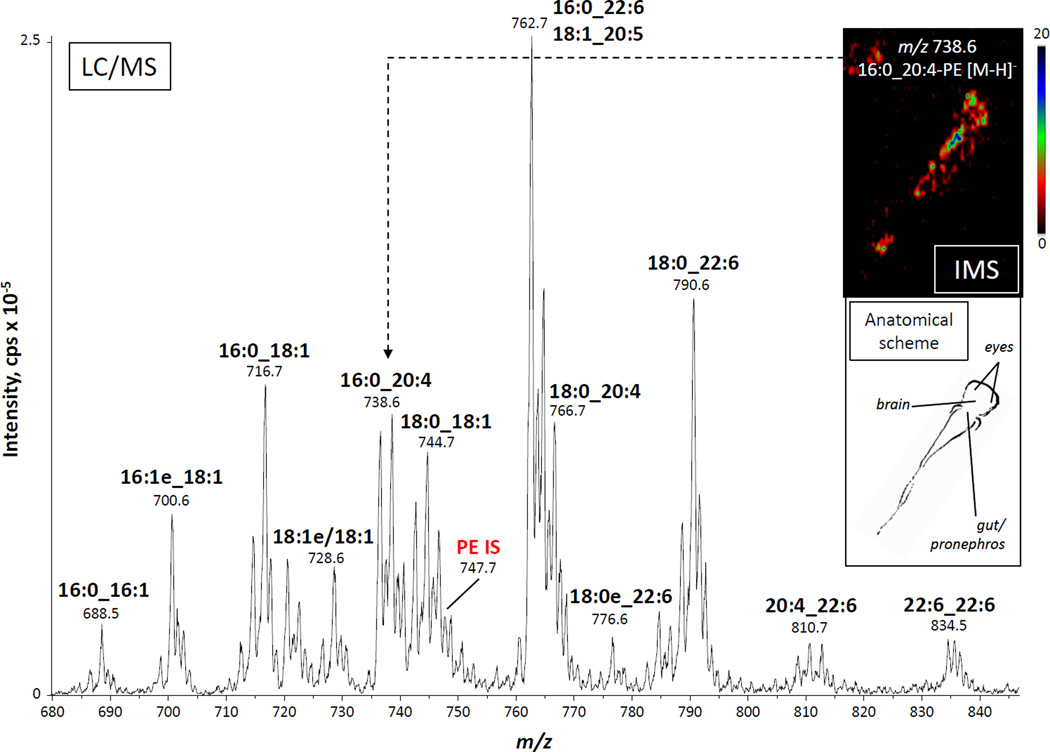
Fig. 1.
Electrospray mass spectrum of phosphatidylethanolamines in an adult zebrafish kidney and mass spectral image of the distribution of 16:0_20:4-PE in larval zebrafish. LC-MS analysis of PEs from an extract of whole zebrafish kidney homogenate. IS: internal standard, [2H31]16:0/18:1-PE. Inset: 10-µm thick slice from a 3 dpf zebrafish analyzed by MALDI-TOF-based imaging mass spectrometry (IMS). The image was generated by plotting the intensity of the m/z 738.6 ion (16:0_20:4-PE). An anatomical scheme based on a public-access atlas (www.zfin.org) is shown to indicate the approximate location of the IMS signal.

