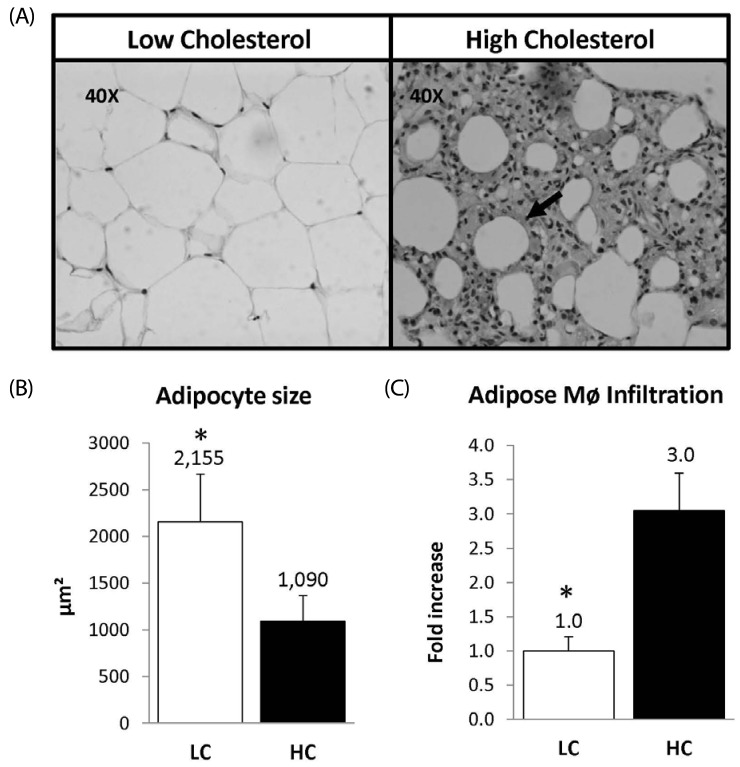
Fig. 2.
Panel A: Epididymal Adipose tissue cross-sections from low and high cholesterol groups. Panel B: Macrophage infiltration, arrows indicate the presence of macrophages detected using the Mac-387. Panel C: Macrophage concentration in the adipose tissue expressed as fold increase. LC (n = 10) HC (n = 10), * indicates P < 0.05.

