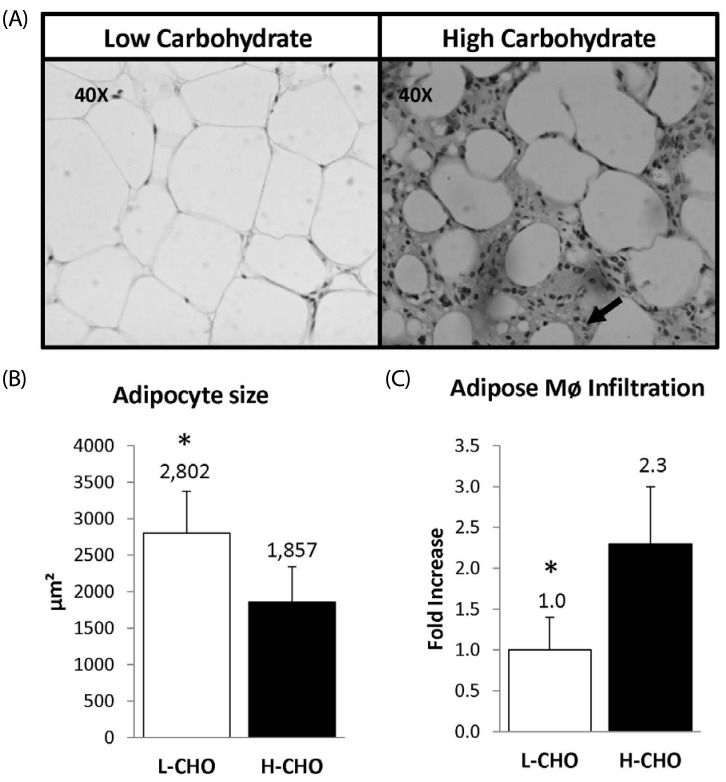
Fig. 3.
Panel A: Epididymal Adipose tissue cross-sections from low and high carbohydrate groups. Panel B: Macrophage infiltration, arrows indicate the presence of macrophages detected using the Mac-387 antibody. Panel C: Macrophage size expressed in µm2. L-CHO (n = 10) H-CHO (n = 10), * indicates P < 0.05

