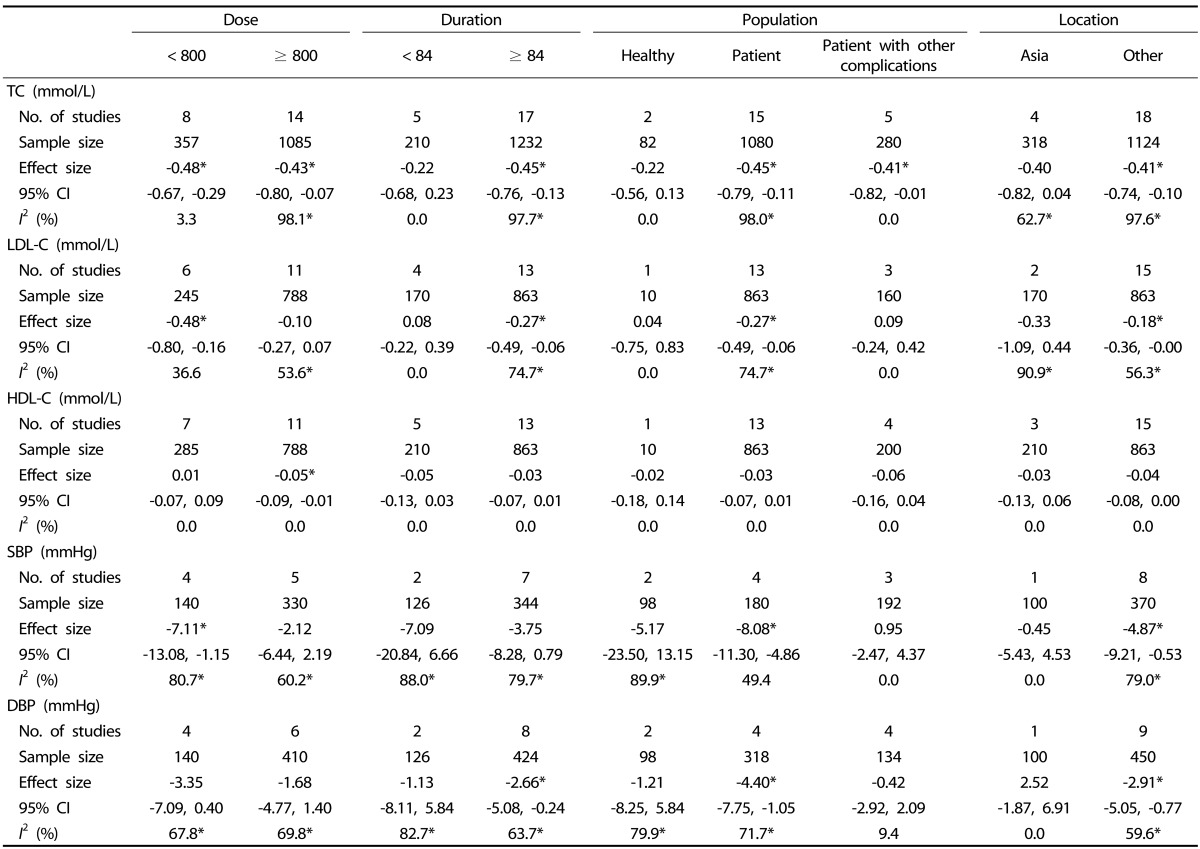
Table 2.
Results of subgroup analyses by dosage, duration, population and location

CI, confidence interval; TC, total cholesterol; LDL-C, low-density lipoprotein cholesterol; HDL-C, high-density lipoprotein cholesterol; FBG, fasting blood glucose; SBP, systolic blood pressure; DBP, diastolic blood pressure;
*P < 0.05
