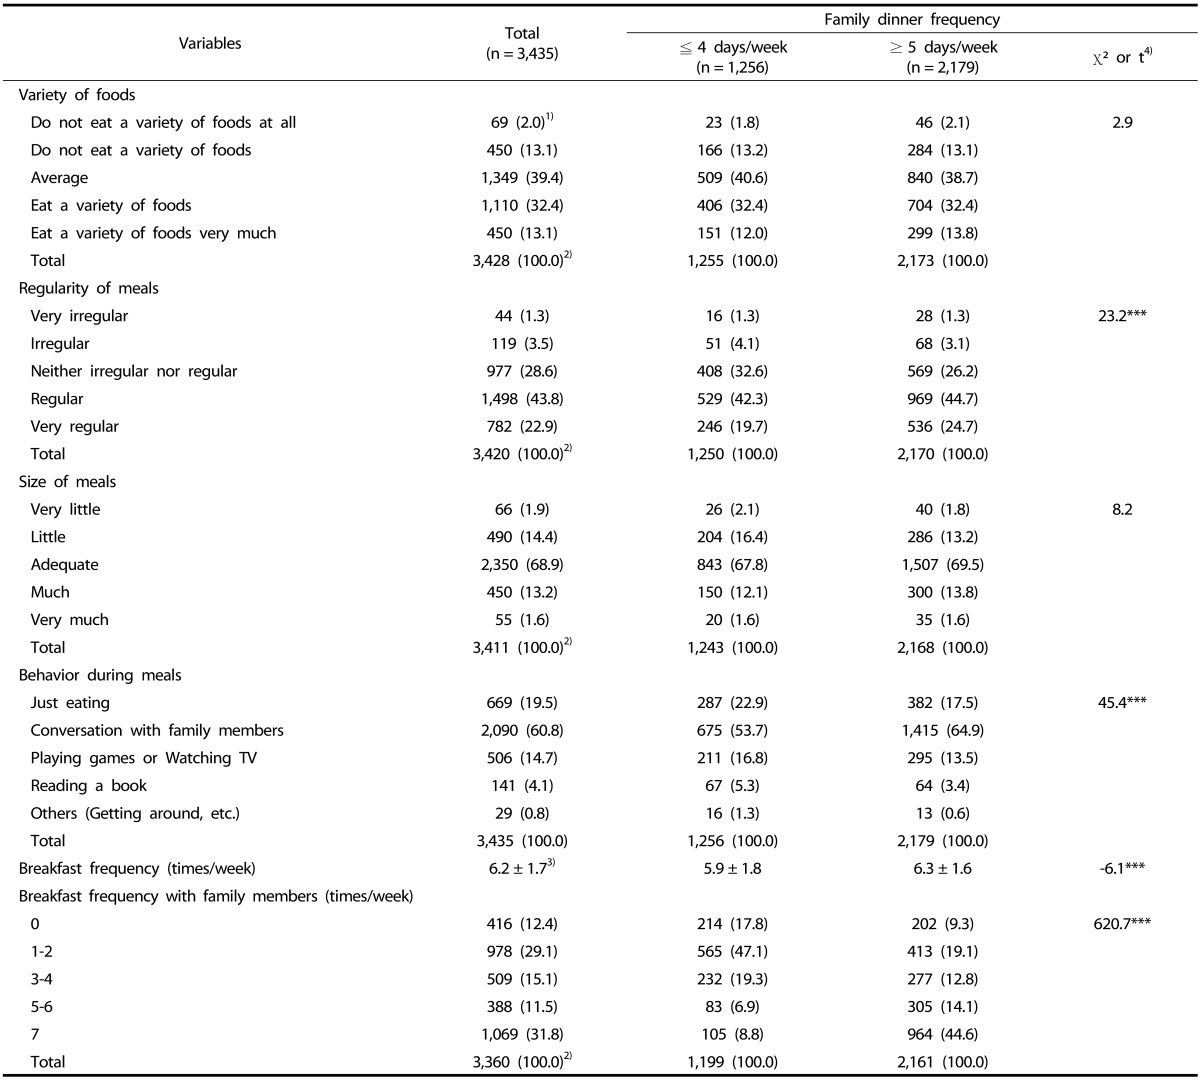
Table 2.
Subjects' eating habits by family dinner frequency

***P < 0.001
1)n (%)
2)Numbers less than 3,435 in total of each variable are unanswered responses.
3)Mean ± SD
4)by χ2-test or by t-test
Subjects' eating habits by family dinner frequency

***P < 0.001
1)n (%)
2)Numbers less than 3,435 in total of each variable are unanswered responses.
3)Mean ± SD
4)by χ2-test or by t-test