
Table 1.
Estimated dietary intake of premenopausal women with overweight/obesity at baseline, week 18 and change over time in a study evaluating changes in body weight, blood pressure and selected metabolic biomarkers with an energy-restricted diet including twice daily dark chocolate snacks plus once daily sugar-free cocoa beverage or twice daily non-chocolate snacks plus once daily sugar-free non-cocoa beverage
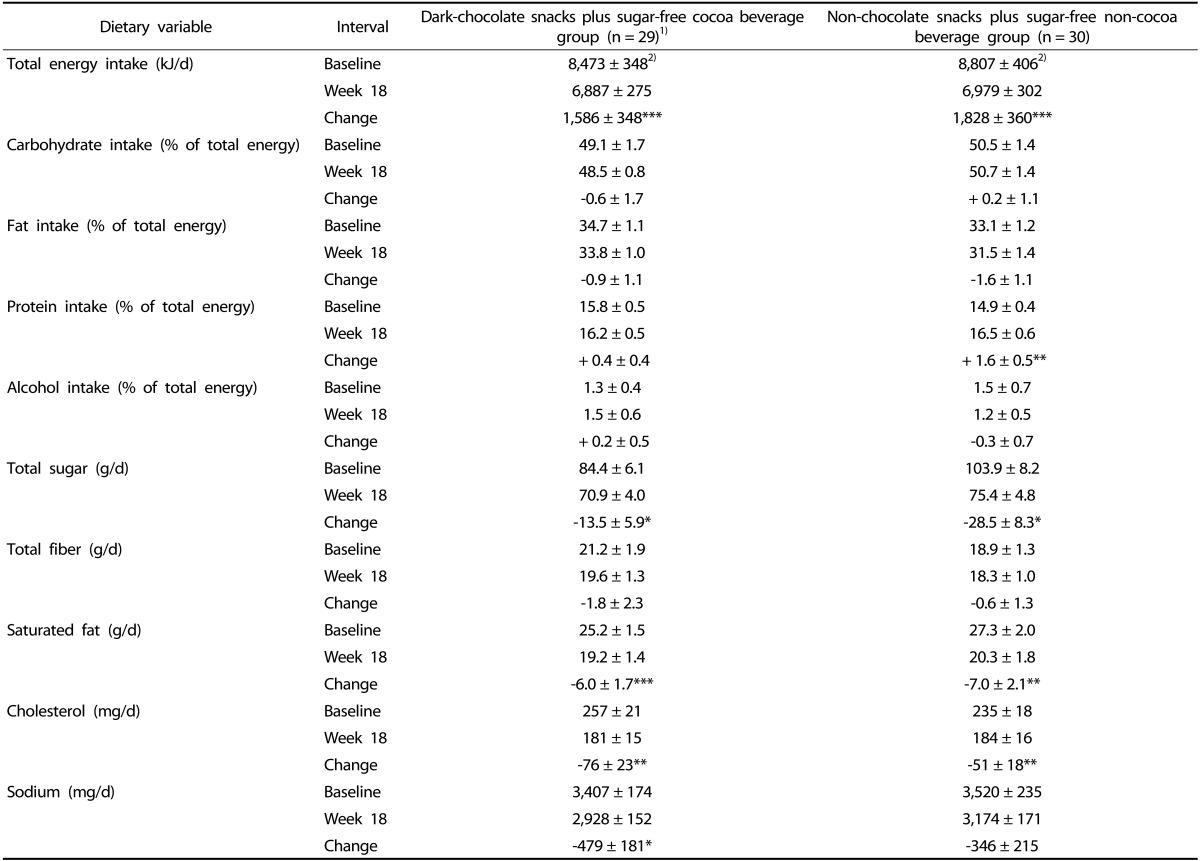
1)Missing data for n = 1 participant.
2)Values are means ± SEM. P-values from intention-to-treat analysis, using analysis of covariance with repeated measures on the time factor.
*P < 0.05, **P < 0.01, ***P < 0.001 within group change from baseline. There were no significant differences in estimated dietary intake variables between snack/beverage groups at any interval or for the change over time between snack/beverage groups.