Figure 2.

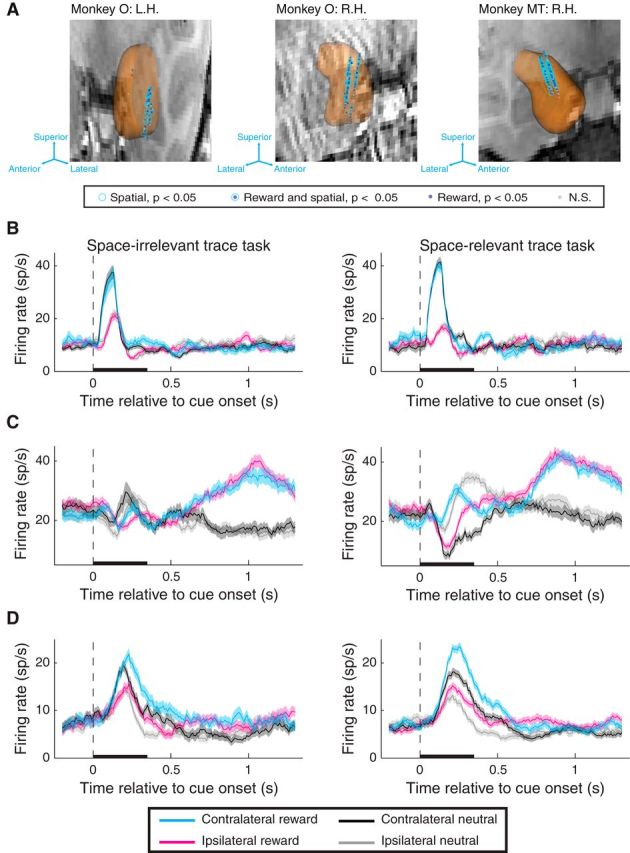
Recording locations and firing rates of individual amygdala neurons. A, 3D reconstruction of the amygdala overlaid on coronal MRI slice for each monkey and hemisphere. Each coronal slice has been tilted to enable visualization of all electrode tracks. Arrows provide the orientation of the slice after tilting. Each data point represents the location of one site recorded during the task and the significance of selectivity for that site (see legend). Significant selectivity is plotted for sites if they exhibited significant selectivity in either task (trace: see Fig. 3; operant: see Fig. 7) in the cue, early delay, and/or late delay epochs; neurons that exhibited significant selectivity that disagreed in sign either across task or across time window are plotted as nonsignificant (N.S.). L.H., Left hemisphere; R.H., right hemisphere. B–D, Firing rate of individual neurons recorded during the space-irrelevant (left) and space-relevant (right) tasks exhibiting significant spatial and/or reward selectivity (p < 0.05). B, Individual neuron that exhibits spatial selectivity during the cue epoch in both tasks. Reward selectivity was not significant in either task. C, Individual neuron that exhibits reward selectivity during the early and late delay epochs in both tasks. Spatial selectivity was significant during the cue and early delay epochs of the space-relevant task but was not significant during any time epoch in the space-irrelevant task. D, Individual neuron that exhibits reward selectivity in the cue and early delay epochs for both tasks and spatial selectivity in the cue delay epoch for both tasks. Black bars represent the duration of the cue. Shading indicates the standard error of firing rates across trials.
