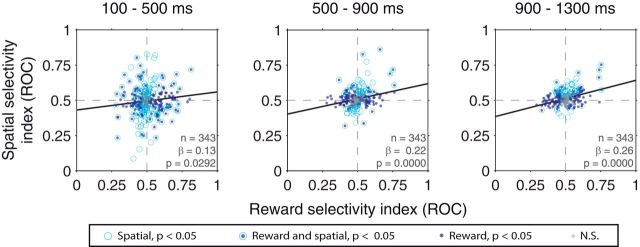
Figure 7.
Relationship between spatial and reward selectivity indices in the operant task. Results are shown for firing rates in the cue (left), early delay (middle), and late delay (right) time epochs. Best-fit regression lines are plotted: Solid lines indicate significant correlations (p < 0.05). Dotted lines indicate nonsignificant correlations. Legend indicates the significance of rewards/spatial selectivity for individual neurons.

