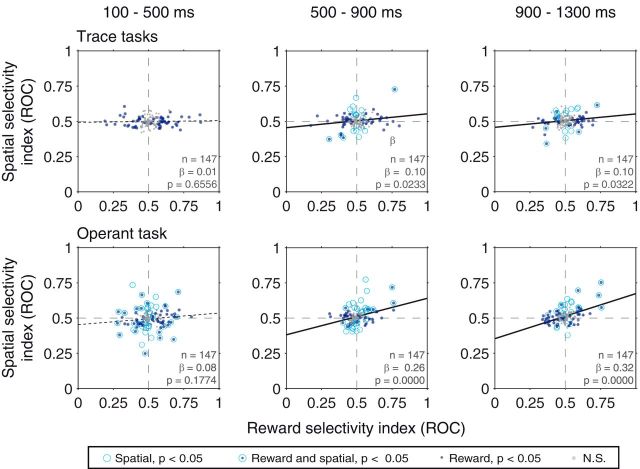
Figure 8.
Relationship between spatial and reward selectivity indices when excluding those neurons with significant spatial selectivity (p < 0.05) during the cue epoch of the trace task. Best-fit regression line are plotted: Solid lines indicate significant correlations (p < 0.05). Dotted lines indicate nonsignificant correlations. Legend indicates the significance of rewards/spatial selectivity for individual neurons.

