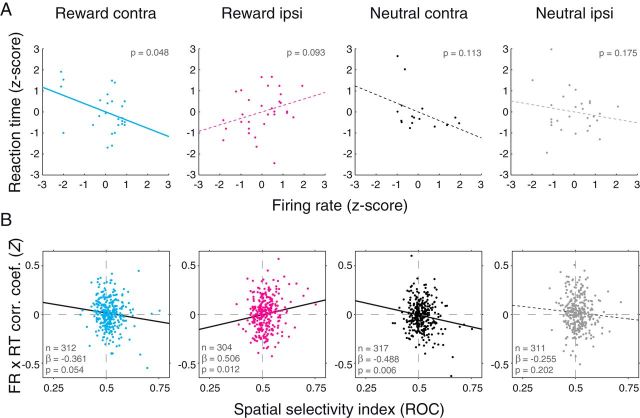
Figure 9.
Trial-by-trial relationship between firing rates and reaction times. A, Correlation between firing rates (x-axis) and reaction times (y-axis) for an individual neuron on each trial type. Firing rates and reaction times were both z-scored within each block to ensure a lack of any across-group correlations. Best-fit regression lines are plotted: Solid lines indicate significant correlations (p < 0.054). Dotted lines indicate nonsignificant correlations. B, Relationship between spatial selectivity (x-axis) and firing rate by reaction time correlation coefficients (Fisher Z-transformed; y-axis) for the population of neurons recorded during the operant task. Best-fit regression lines are plotted as in A.

