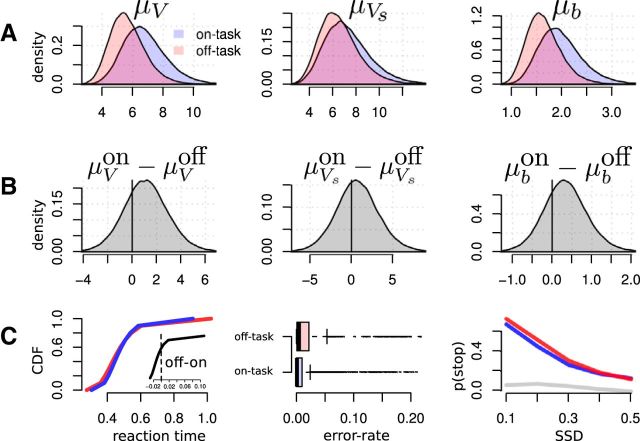
Figure 6.
Posterior distribution of the group-level means and posterior predictions. A, Posterior distributions of group-level mean parameter for V, Vs, and b overlaid for on- versus off-task. B, The distribution of differences between on- versus off-task and (C) posterior predictions for RT, error-rate and probability of stopping (left to right). Blue signifies on-task and red codes for off-task parameters.

