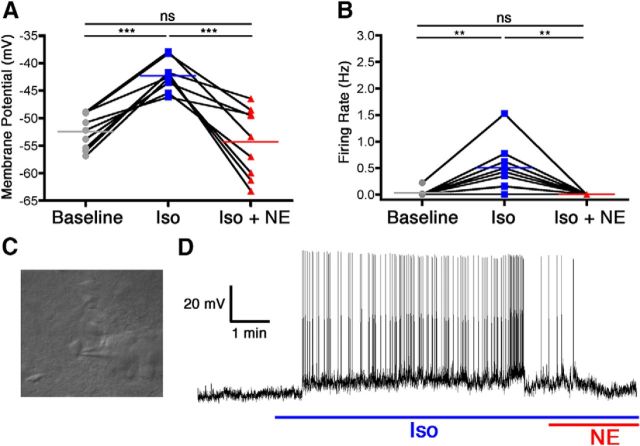
Figure 1.
Norepinephrine reversed isoflurane-induced activation of VLPO neurons. Membrane potential (A) and firing rate (B) of nine neurons at baseline, during isoflurane exposure (Iso), and during concomitant isoflurane and norepinephrine exposure (Iso + NE). Connected points represent paired responses of individual neurons; colored lines represent group means. Data were analyzed with a one-way ANOVA and post hoc Bonferroni's-corrected comparisons. **p < 0.01; ***p < 0.001. C, Representative image of an electrode patched onto an isoflurane-activated VLPO neuron. D, Representative membrane potential trace from a current-clamped VLPO neuron showing depolarization and increased firing caused by isoflurane exposure (blue line) and ensuing hyperpolarization and decreased firing caused by simultaneous exposure to isoflurane and norepinephrine (red and blue lines).

