
Figure 8.
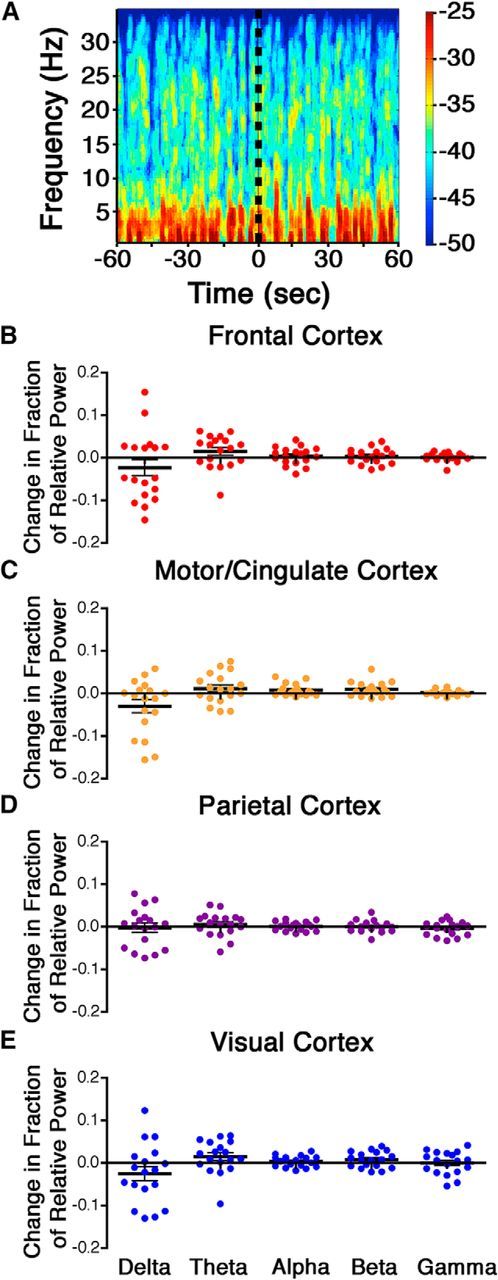
There is no change in spontaneous cortical EEG power after dexmedetomidine injection in the VLPO. A shows a representative spectrogram from the parietal cortex of a mouse before and after injection of dexmedetomidine into the VLPO (indicated by the dotted black line). The change in relative power from preinjection to postinjection was measured over the frontal cortex (B), motor/cingulate cortex (C), parietal cortex (D), and visual cortex (E) for five different frequency bands: delta = 0.5–4 Hz, theta = 4–8 Hz, alpha = 8–12 Hz, beta = 12–20 Hz, and gamma = 20–35 Hz. Black bars show the mean with SE for each dataset. Data were analyzed by two-tailed one-sample t tests with a Holm's sequential Bonferroni's correction for multiple comparisons.