
Figure 1.
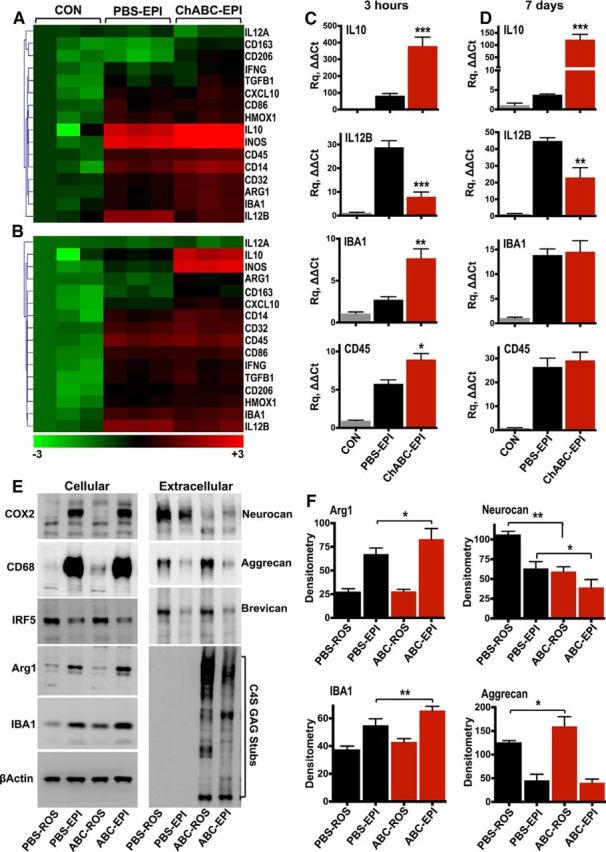
ChABC treatment alters the inflammatory response after SCI. A, B, Heat maps display normalized [−3 (green) to +3 (red)] differences in relative gene expression quantified by TaqMan quantitative PCR in the injury epicenter (EPI) of either PBS- or ChABC-injected cords 3 h (A) and 7 d (B) postinjury. Fold change in mRNA expression was calculated using the ΔΔCt method, relative to control (CON) T10 spinal cord collected from uninjured animals. GAPDH served as the housekeeping gene. Statistical analysis was performed using one-way ANOVA and, for multiple comparisons, using he Holm–Sidak test (PBS-EPI vs ChABC-EPI). C, D, Graphs depict quantitative PCR relative quantitation (Rq ΔΔCt) for IL-10, IL-12B, IBA1, and CD45 in control, PBS-injectd, and ChABC-injected cords 3 h (C) and 7 d (D) postinjury. Results are reported as the mean fold change in gene expression ± SEM, n = 3 animals per group. Statistical analysis was performed using ANOVA, and for multiple comparisons the Holm–Sidak test (PBS-EPI vs ChABC-EPI). *p < 0.05, **p < 0.01, ***p < 0.001. E, Cellular and extracellular protein levels were measured by Western blotting of the T10 injury EPI of PBS- and ChABC-injected spinal cords, 7 d postinjury. F, Intact tissue was collected from rostral (ROS) T1 spinal cord of the same animals to control for protein changes caused by injections on uninjured tissue. Protein levels were quantified by densitometry (F). Results are mean density values ± SEM, n = 3 animals per group. Statistical analysis was performed using ANOVA, and for multiple comparisons using the Holm–Sidak test. *p < 0.05, **p < 0.01.