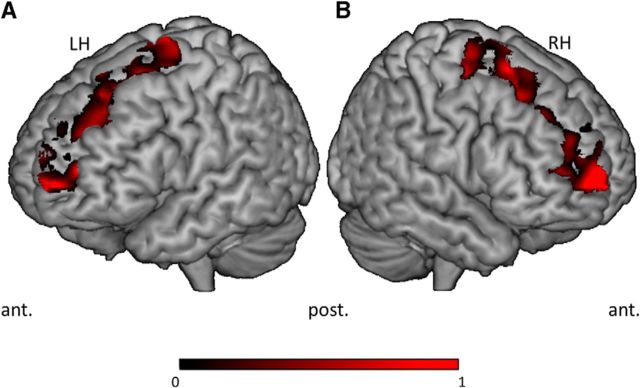
Figure 4.
Discrimination maps for left (A) and right (B) superior frontal gyri. Spatially distributed map of voxels in left and right superior frontal gyri which most strongly discriminated among subjects who were more or less reward dependent (low and high NLL, respectively). The color map depicts the relative weight of each voxel in the discrimination.

