Figure 3.
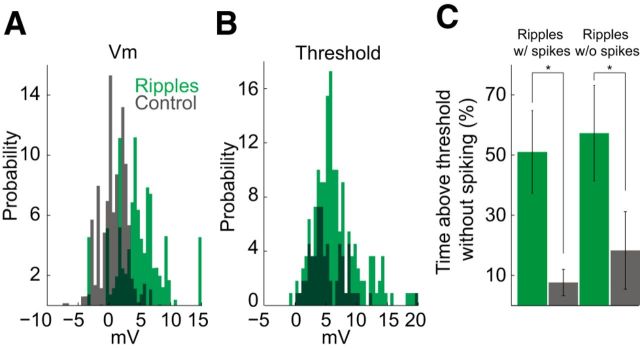
Ripples increase spike threshold. A, Vm distribution in ripples (detected in the Vm; green) and during corresponding preripple control intervals (gray); n = 11 neurons. A baseline value (mean of Vm sampled from a 500 ms window at −1000 ms before ripple peak time) was subtracted from each ripple Vm value (ripple Vm was determined from a 30 ms window at −10 ms before ripple peak time) and from the preripple control Vm value (control Vm was a 50 ms window at −110 ms from ripple peak time) to control for potential DC drift. Spikes (Vm from −2 to +3 ms from spike time) were excluded. B, Threshold distribution in ripples (green) and out of ripples (gray), n = 10 neurons. C, Percentage of time above threshold without spiking during ripples (green) and during preripple control intervals (gray), for ripples with spikes (left; p = 0.0063) and for ripples without spikes (right; p = 0.040); calculated independently for each neuron; n = 10 neurons.

