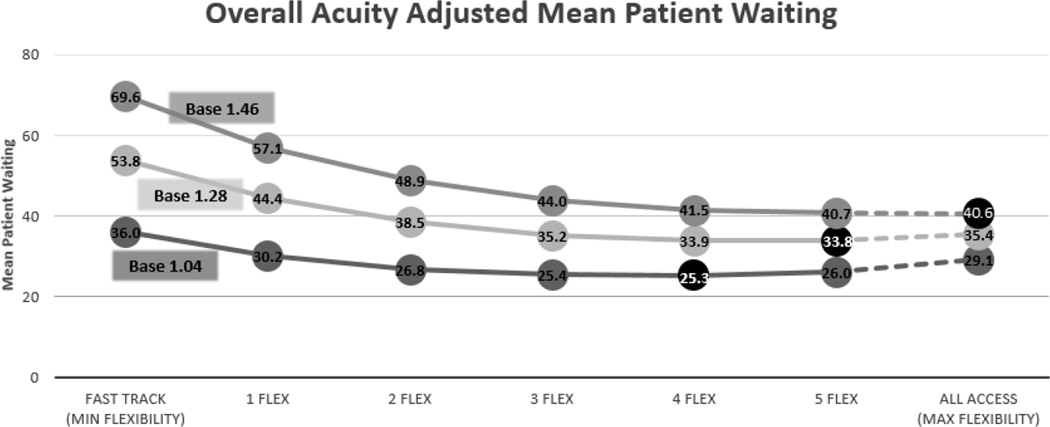
Figure 6.
This figure illustrates the acuity adjusted mean patient waiting. With a base adjusted value of 1.04, 4 flexible beds produces the lowest overall mean wait. As the acuity adjusted base approaches 1.46, the lowest overall mean wait can be found with the all access (max flexibility) policy.
Acuity Weights: ESI2 = (base)^3; ESI3 = (base)^2; ESI4 = (base;) ESI5 = 1.

