
Fig. 3.
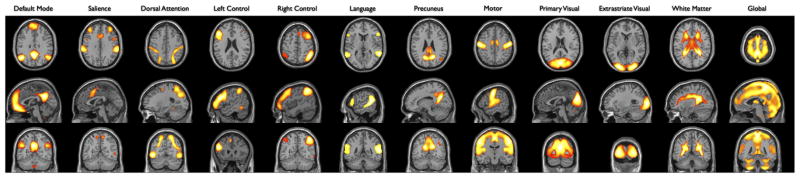
Thresholded maps used to compute whole network measurements. These maps were created by taking the raw template maps and thresholding at factor loadings >100 (all with corresponding p-values much less than an alpha = 0.05 FWE correction). All values within these masked images were averaged to create the whole network metric for each template analyzed.