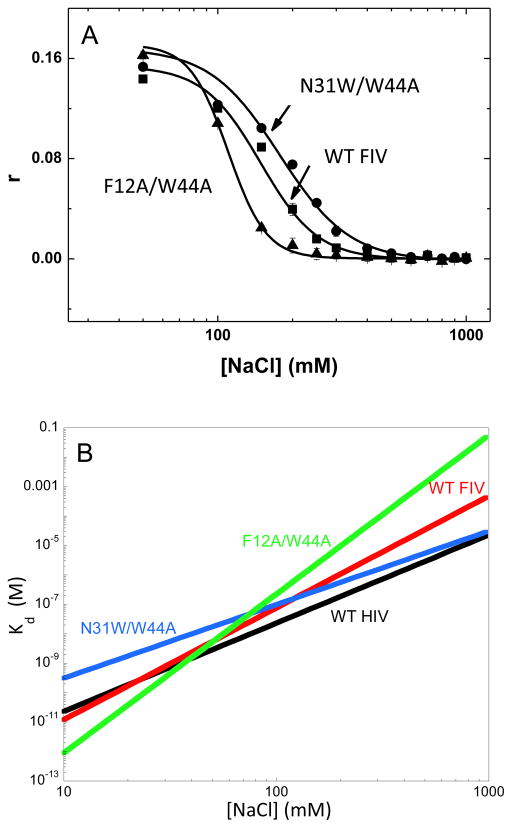
Fig. 2.
(A) FA as a function of salt concentration for WT, N31W/W44A, and F12A/W44A FIV NC binding to ssDNA20. (B) Salt dependence of the dissociation constant, Kd([Na]), of several NC variants from ssDNA20, for WT FIV NC (red line), N31W/W44A FIV NC (blue line), F12A/W44A FIV NC (green line), and HIV-1 NCp7 (black line, (Wang et al., 2014). The Kd([Na]) were calculated according to Eq. (1) using parameters Kd,(1M) and Zeff (Table 2) fit from the salt titration curves (data in panel (A)).

